Sharing data from your own scientific publication
What better way to start working with open data than by sharing a Data Package from one of my own publications? In this tutorial, I will explain how to use the Frictionless Data tools to share tabular data from a scientific publication openly. This will make easier for anyone to reuse this data.
The data we are going to use comes from a free-to-view scientific article:
Daniel Alcalá-López, Jonathan Smallwood, Elizabeth Jefferies, Frank Van Overwalle, Kai Vogeley, Rogier B Mars, Bruce I Turetsky, Angela R Laird, Peter T Fox, Simon B Eickhoff, Danilo Bzdok, Computing the Social Brain Connectome Across Systems and States, Cerebral Cortex, Volume 28, Issue 7, July 2018, Pages 2207–2232, https://doi.org/10.1093/cercor/bhx121.
One of the reasons I chose this paper is because it is a meta-analysis I conducted a few years ago. The first task I had to carry out at the beginning of this project was to collect all the relevant bibilography (in this case, on neuroimaging studies on social cognition), then select previous coordinate-based meta-analyses (a subtype of neuroimaging meta-analysis), and finally extract the standard coordinates reported in the results of these studies. This involved many hours of visually scanning articles and manually transcribing tables of results into a spreadsheet. Obviously, this is not the best use of a researcher's time, and that is why I think it is convenient to facilitate this work to anybody who might be interested in reusing the data from my own publication.
One of the main products of this study is the set of brain regions that we call the Social Brain. This is a set of 36 brain regions identified as relevant for the processing of social information –that is, information about other individuals. In the paper, we use these regions as seeds for different brain connectivity analyses, but they can still be used for much more!
The neuroimaging files in compressed NIfTI format (.nii.gz) with the 36 volumes are available in the ANIMA open database. But the paper also includes a couple of tables with relevant information that we can share in a Data Package.
Step 1: getting the data
First thing we need to do is fetch the tabular data. We can do that by copy-pasting from the web version or the PDF file of the paper into a spreadsheet. In both cases, we will need to do some cleaning, since the styling of the table introduces elements designed to make the information more human-readable but makes it harder to work with when using a different programming language or analysis software than the original.
Now that we have our data in a simple tabular format, we want to save it as a comma-separated values (CSV) file. This will make our data more accessible, as most tools can work with this file format. To make sure everyone can find the data, we're going to upload it to a public repository in GitHub. If you're not familiar with the git version-control system or the GitHub website, I recommend you take a look at this guide from The Turing Way: Version Control.
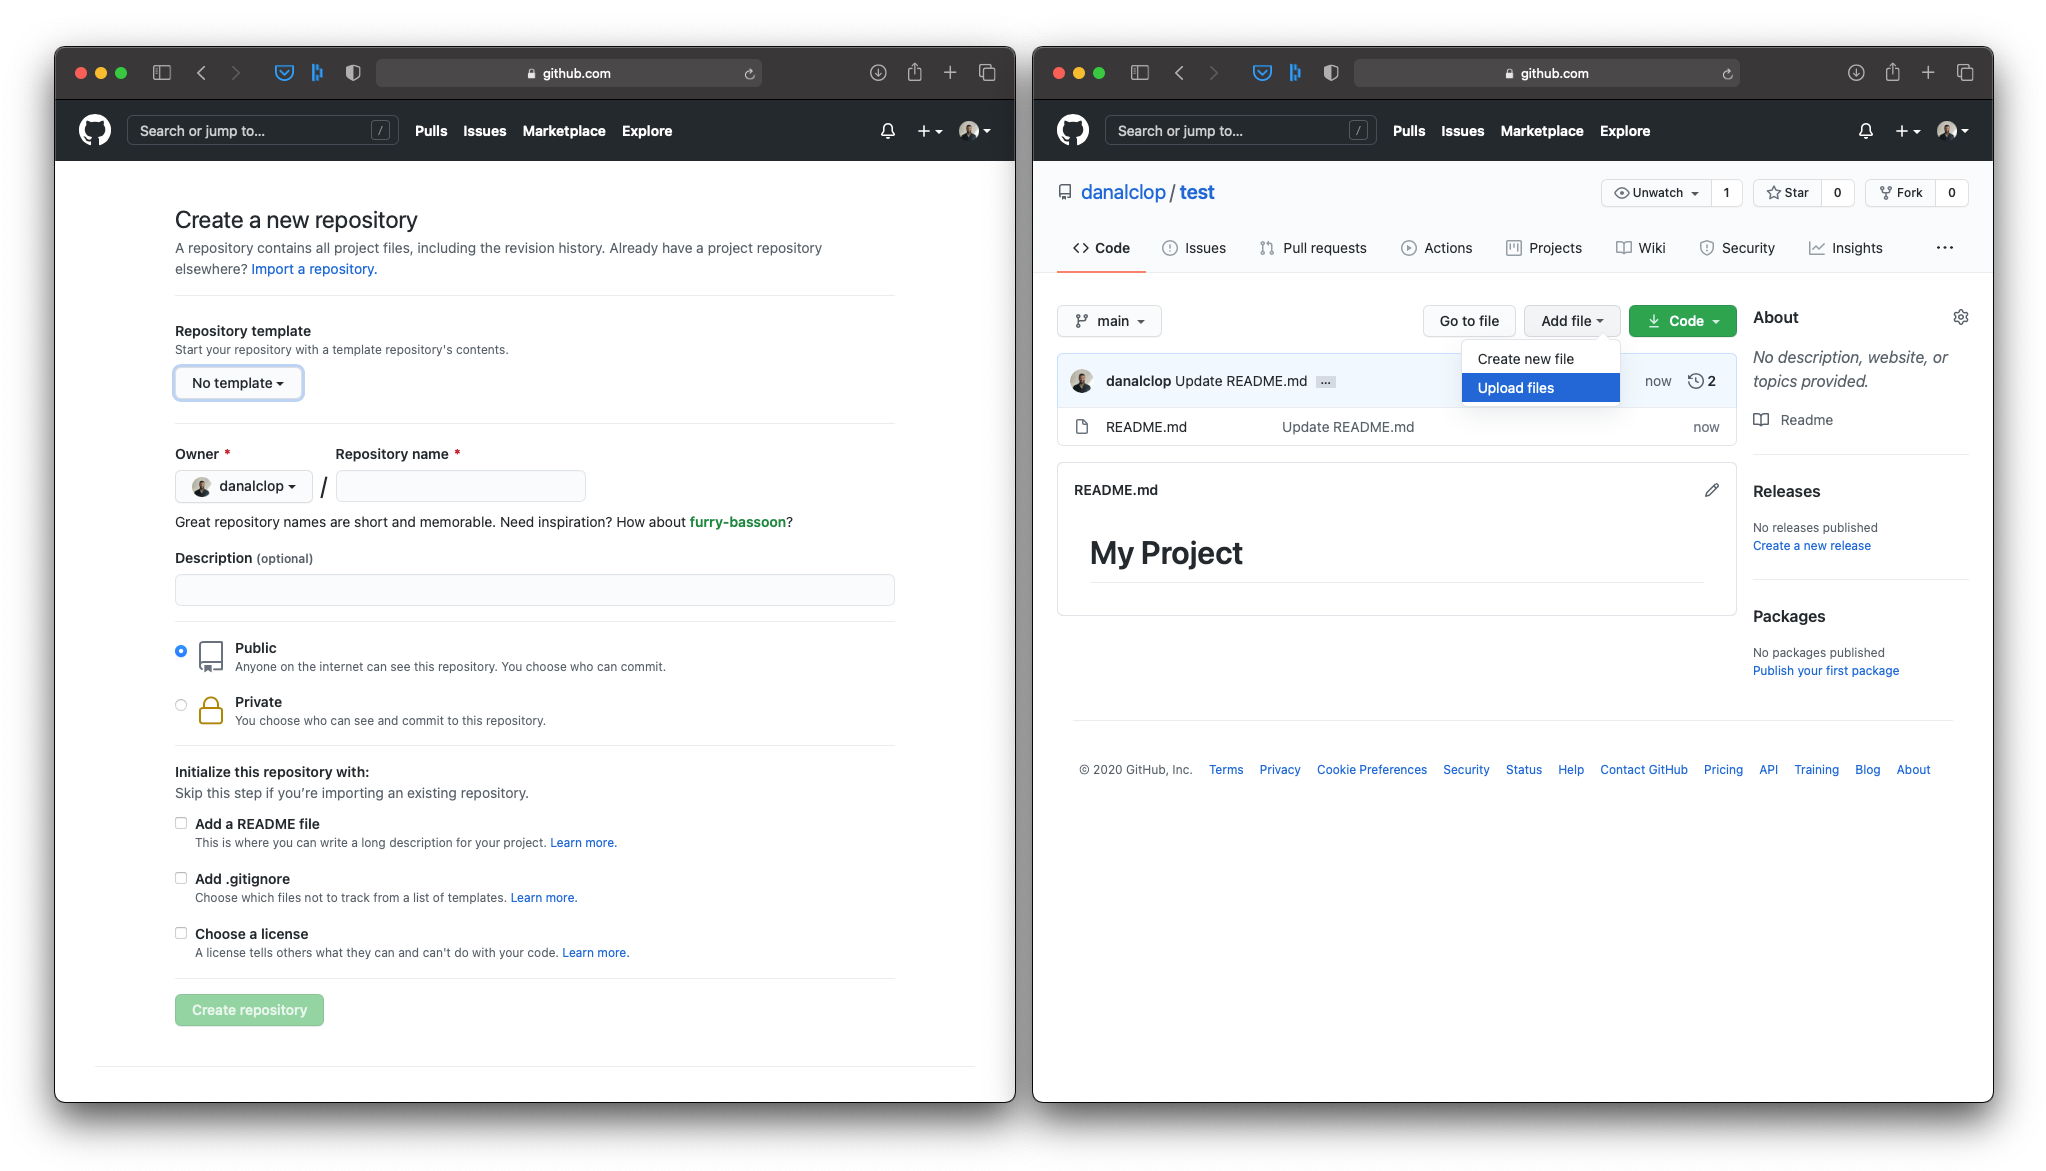
Create an empty repository to host your data.
CSV files are very versatile, but cannot handle the metadata with all the necessary context. We need to make sure that people can find our data and the information they need to understand our data. That's where the Data Package comes in!
Step 2: creating a Data Package
We are going to build a kind of container in which we can throw both our data file and all that important information that people will need to work with our data (e.g., information about our variables and measurement units, data types, use license, etc.). If you want to read more about the Data Package, you will find the specifications here.
To do this, we will be using the Data Package Creator. Although we can create a Data Package through the command-line tools, we will use the browser tool for simplicity. But have a look at the different Frictionless Data libraries once you finish!
One of the benefits of a Data Package is that you can put together different data resources that are related to one another. This is our case, since we want to create a Data Package with the information from tables 1 & 2 in the paper. Thus, I like to start filling up the metadata of the Data Package on the left panel, before I move on to adding data resources:
- We are going to give a (machine readable) name and a (human readable) title to our Data Package;
- Then we will add a description, so people know this data comes from a our paper;
- You can also add the DOI in the home page field. Since a DOI is like a persistent URL, we know that it won't change in the future, and people will always be able to find the corresponding paper from the metadata in our Data Package;
- We can also add a version number to the Data Package. This is particularly interesting if you assume you will be updating the data resources in the future, for example during data collection.
- We will add now an often disregarded, yet fundamental, aspect of open data: a license. Without a license, people cannot know whether they are allowed to use your data. Here you will find a list of possible licenses that you can use, but also you can add any other license. If you want to read more about each license, selecting one will generate a link to the Creative Commons website where you can read about the details of that license. Very handy if you are not sure what kind of license to use!
- Finally, we will add as many relevant keywords as we can, as this will make out data more findable;
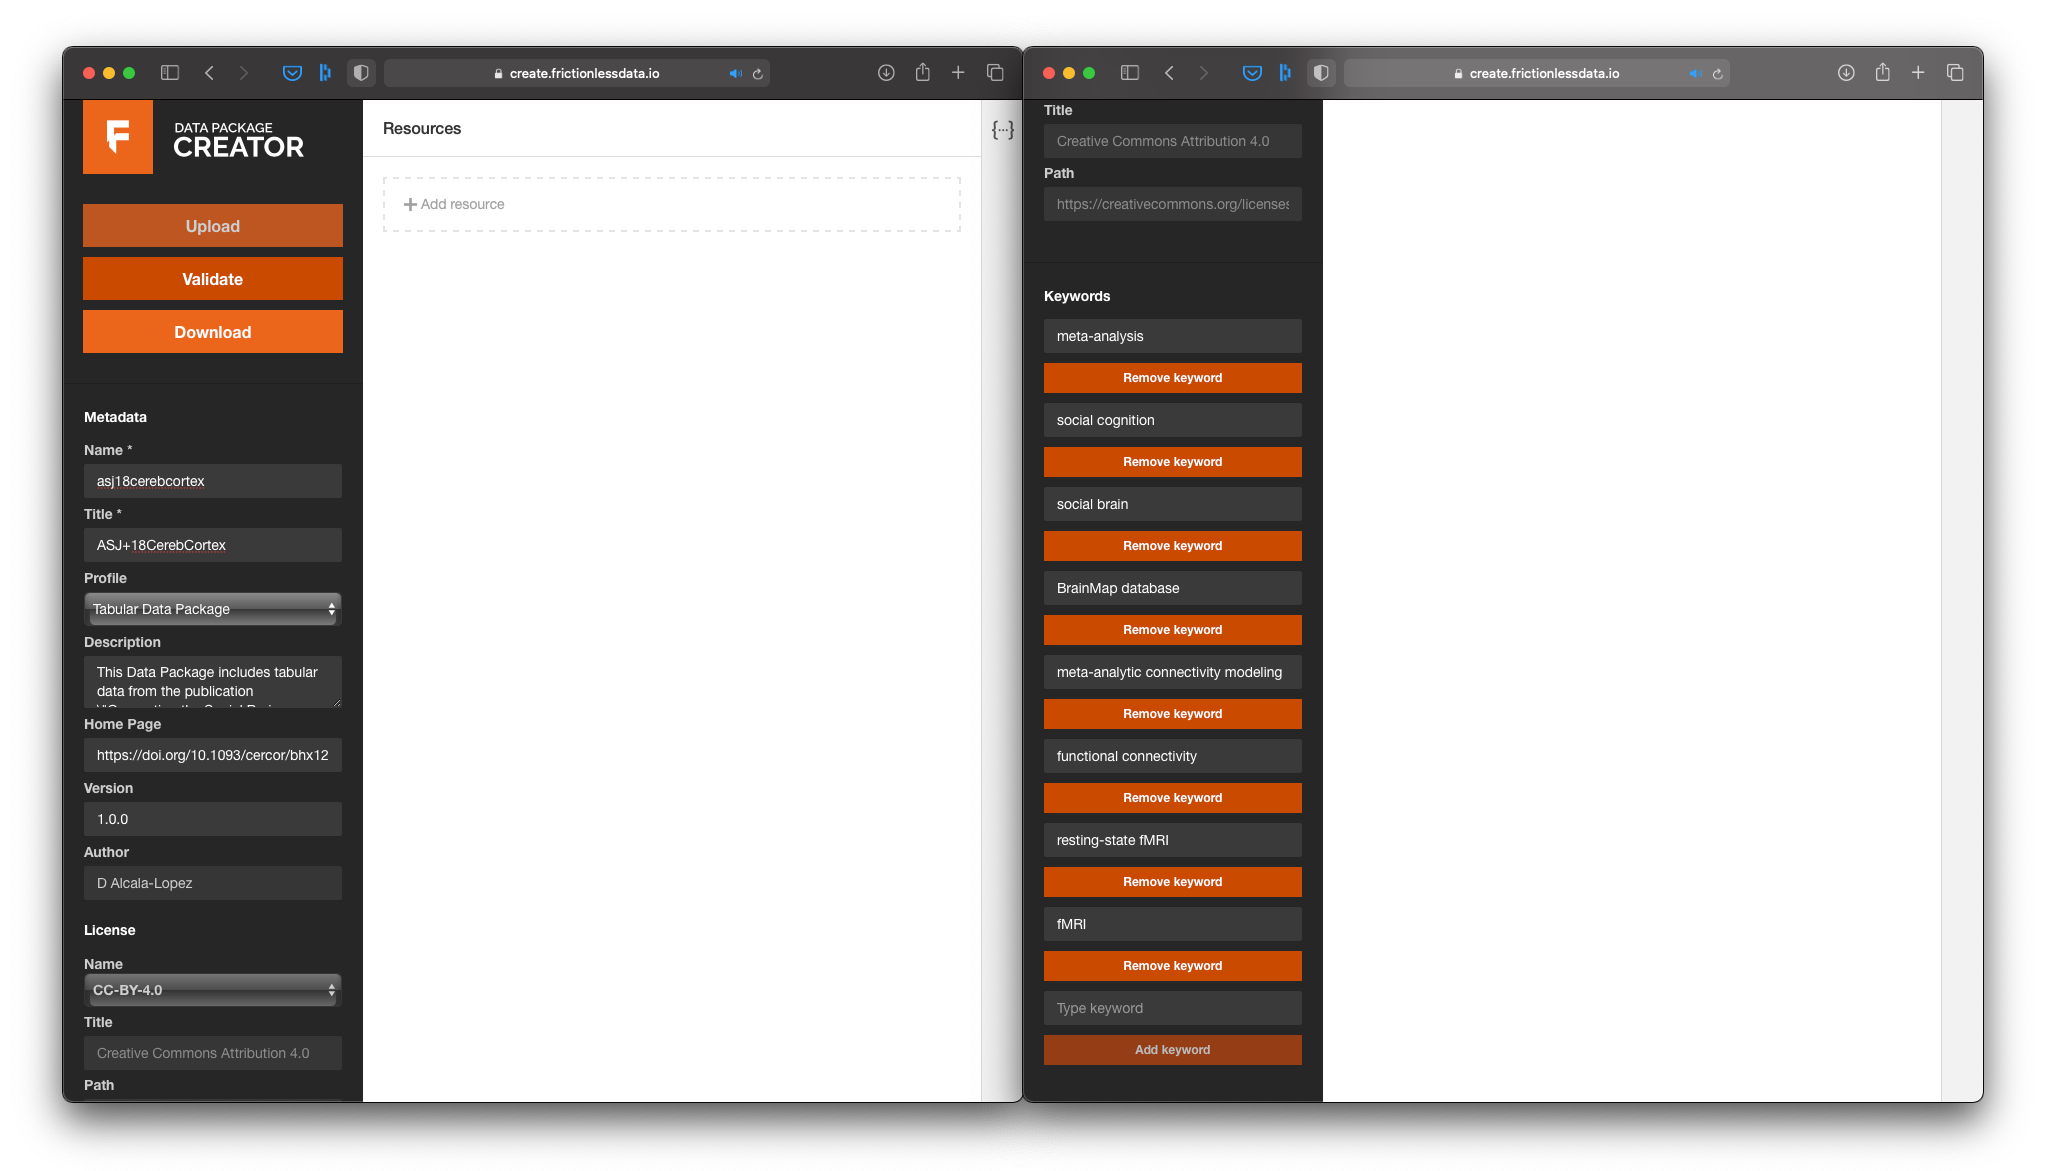
First things first: Add as much metadata as you can to the Data Package.
Now we're ready to add some data!
Step 3: adding data resources
At the top of the central panel, we will see that we can add the name and path to a data resource. The best option for us is to use the link to the data we have just uploaded to GitHub, rather than uploading the data again from our computer. This way, other people will be able to find our data through that link as long as they have access to the Data Package metadata.
After we load the path to the data from Table 1, the Data Package Creator will automatically infer some of the characteristics of our data. First, it will show us how many columns it found, so that we can choose whether we want to import them all or just a subset. The you will notice that it also inferred the header and data type of each column. Make sure the latter is correct, since this will be important for the validation of our data.
Once everything is fine, we will add a second resource with the data from Table 2. Again, we will let the Data Package Creator infer the metadata and we will simply check and correct any mistake:
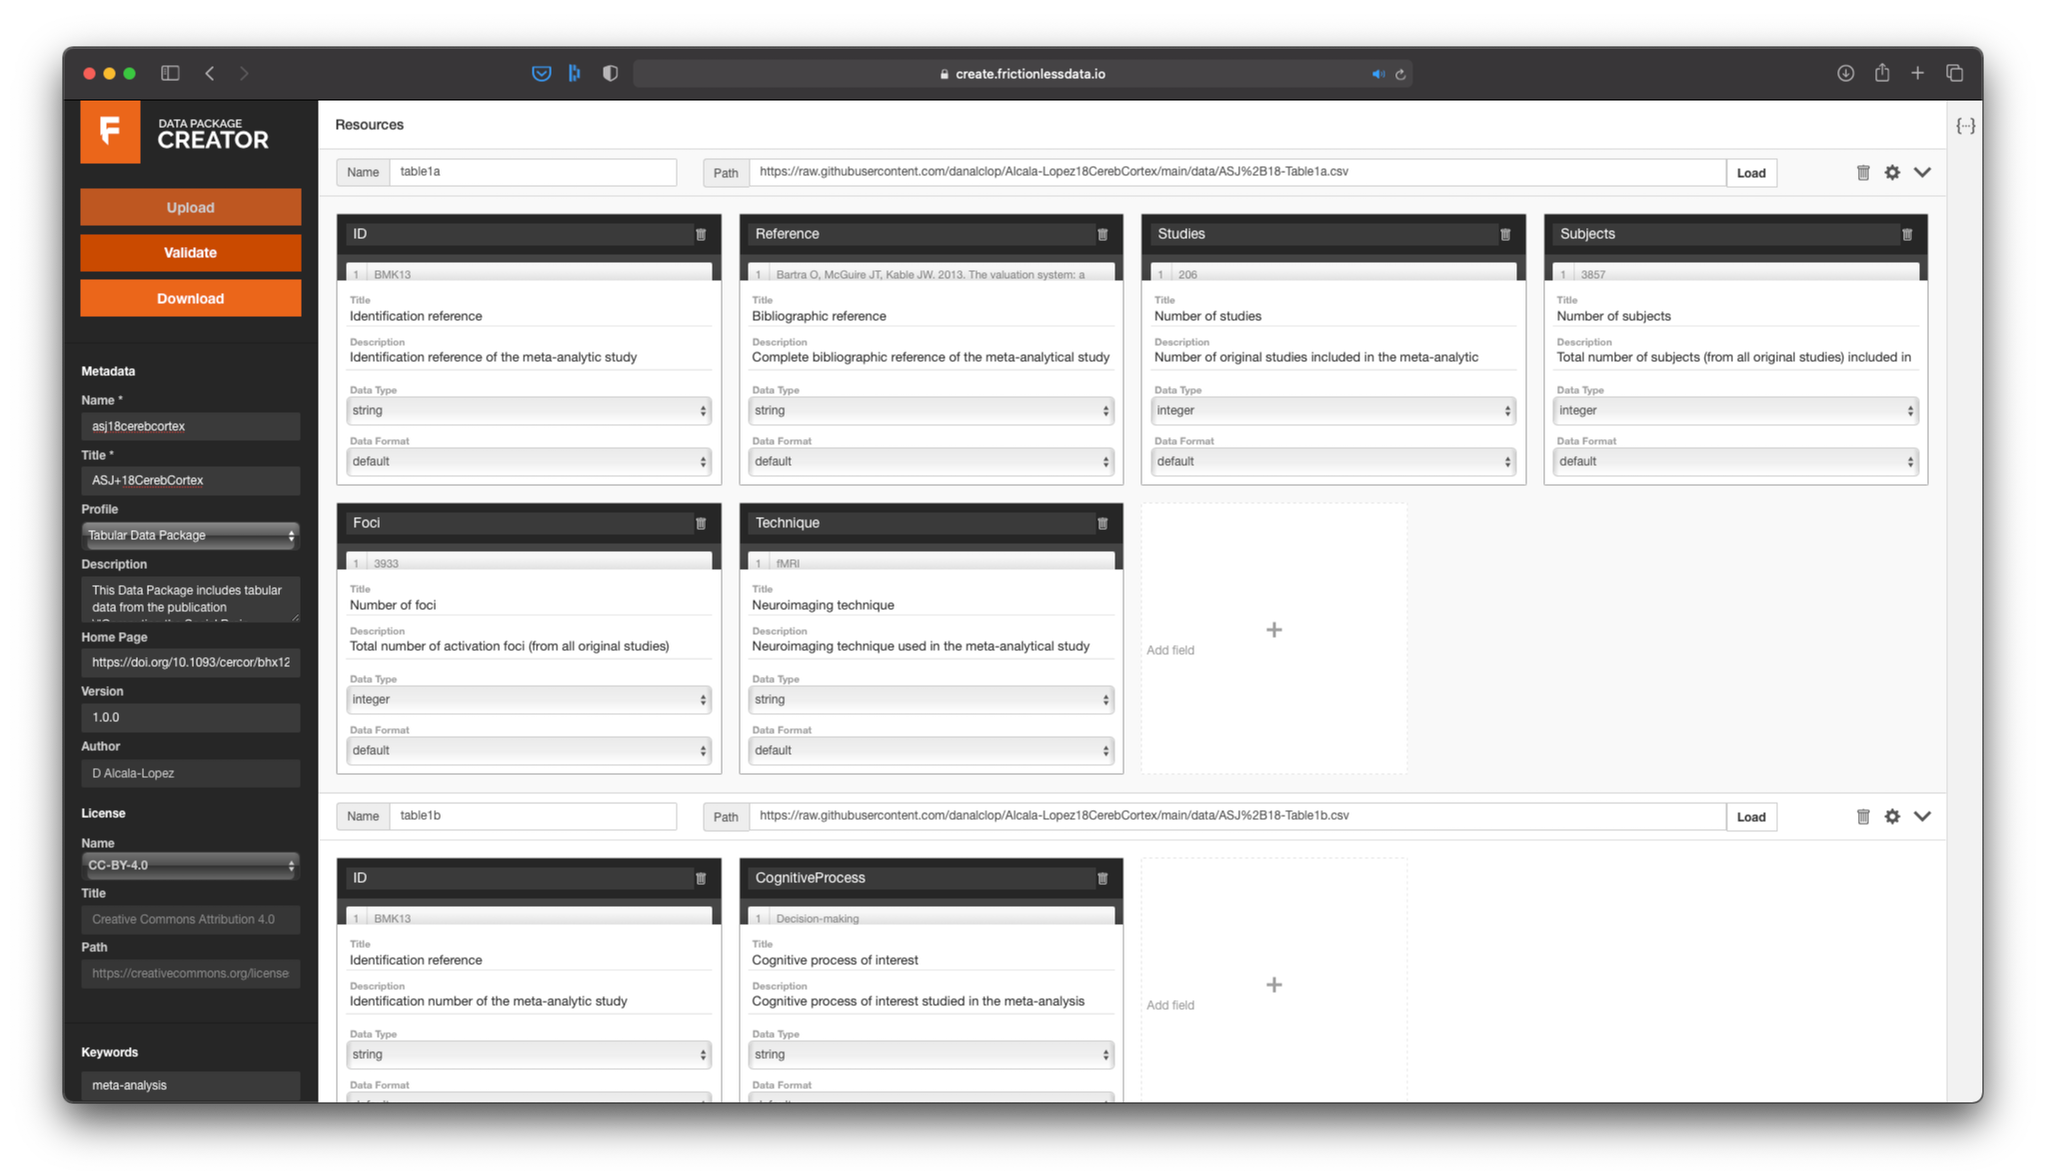
You can add as many data resources as you need to one Data Package.
Almost done! We're ready to hit the Validate button and see whether everything looks good. If the Data Package Creator finds any problem with your data or metadata, it will tell you what is it so you can easily fix it.
Once we're done, we hit the Download button, which will give us a JSON file. This file has all the metadata that we introduced in a machine-readable format. This will allow anyone to read out our metadata using any tool they want. So now we only need to upload this JSON file to our GitHub repository, and seee how it looks:
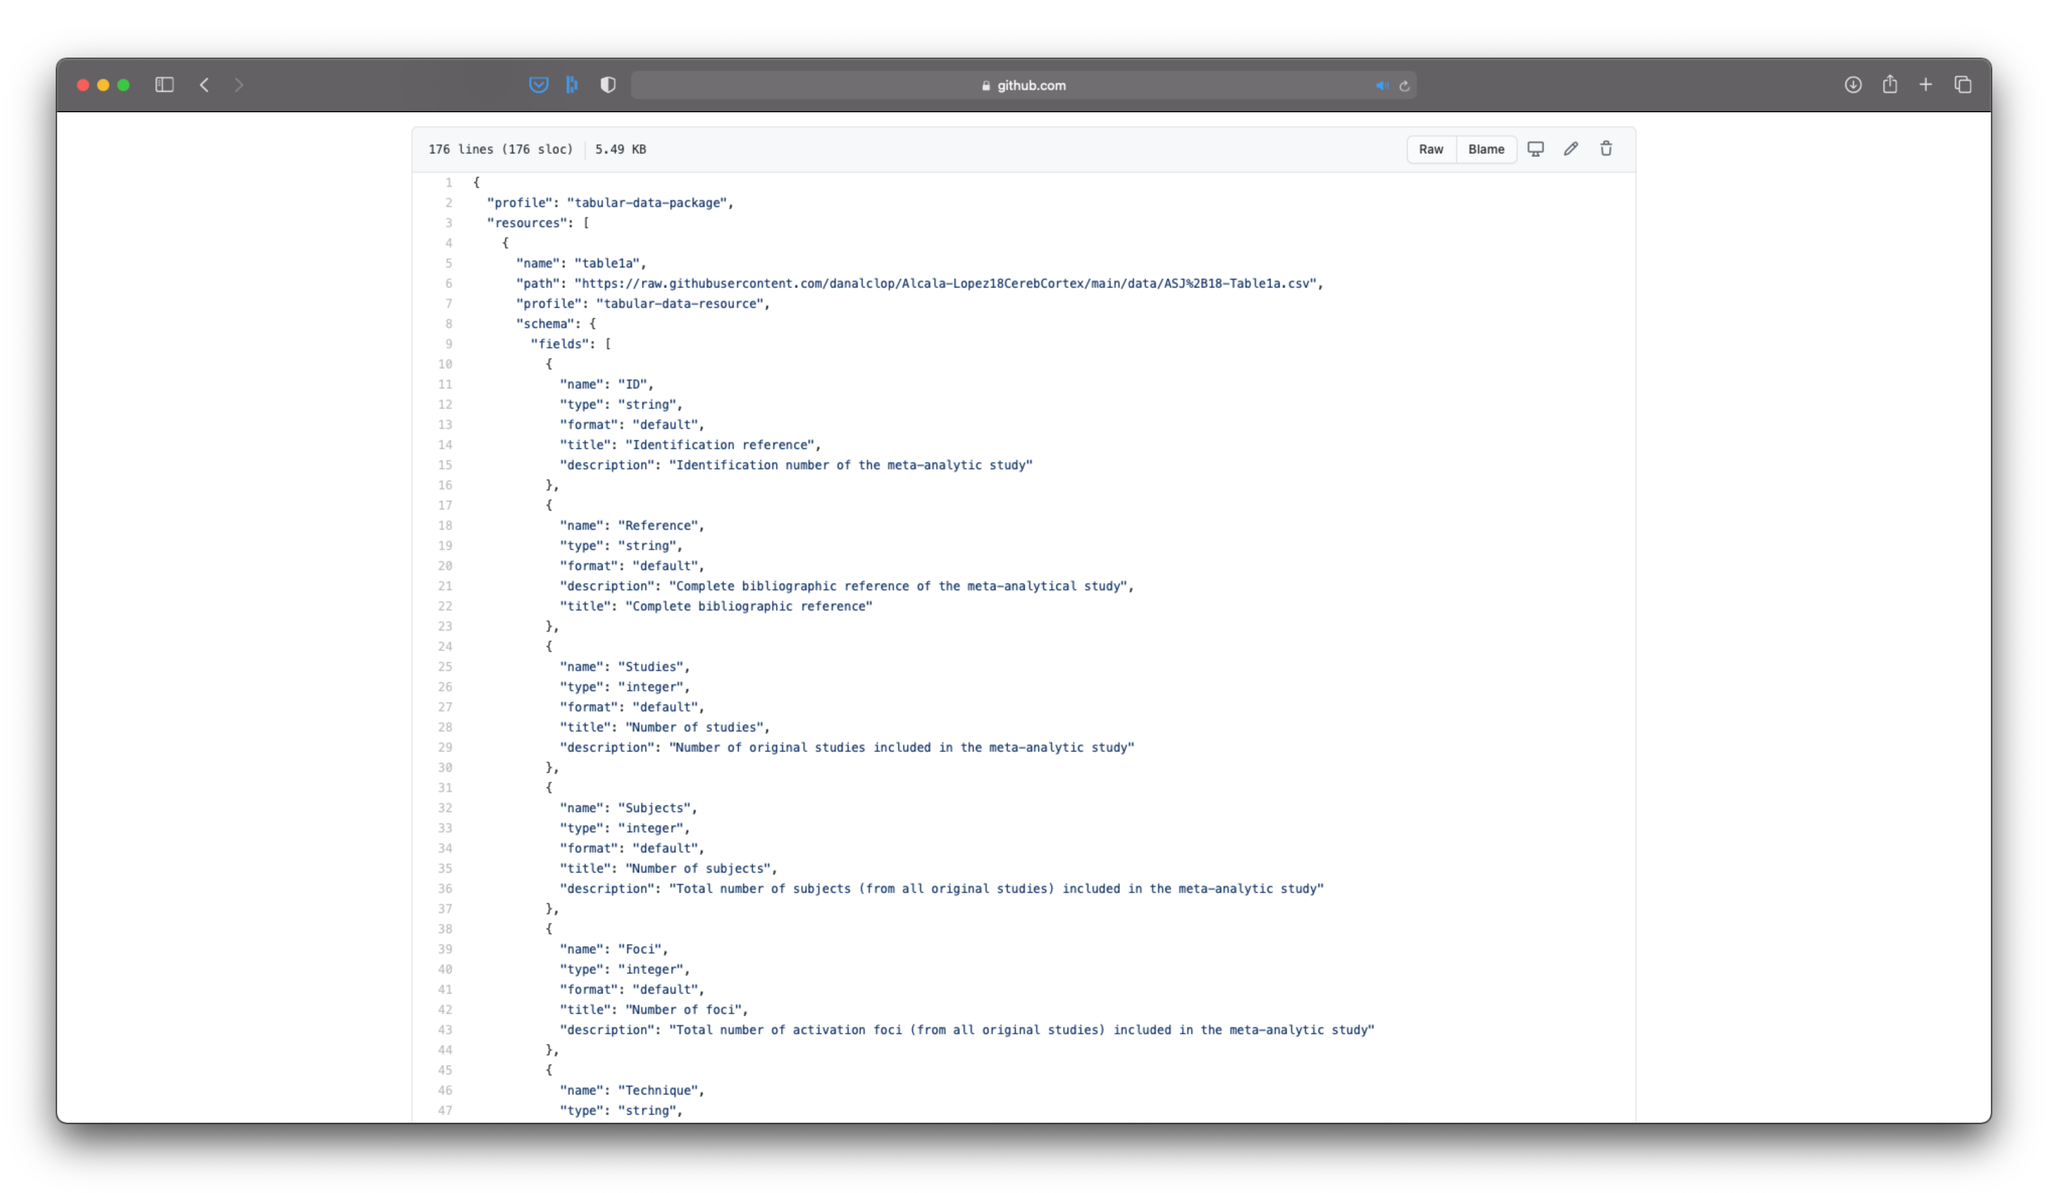
Your Data Package now includes both the data and the relevant metadata.
Conclusions
If we want to share our data with the rest of the scientific community and with society in general, we must first think about what they might need to understand and make good use of the data.
In this tutorial we have seen how we can package our data with all the meta-information that a person who wants to use our data might need. Now, my publication is accompanied by a GitHub repository where any researcher or layperson can find, visualize, and download the data with the results of my study.
Want to know more about the Frictionless Data tools? Go check out the Field Guide for more examples and tutorials.