Creating a datapackage for microbial community data (and a phyloseq object)
Introduction
I study bacteria, and lucky for me, bacteria are everywhere. Regardless of society’s best efforts to sanitize, microbes find a way to thrive in even the most unlikely places.

For instance, scientists believed the bladder was sterile1 for decades, however recent research has proved otherwise. It turns out the number of bacteria in the bladder is so low, previous methods were not sensitive enough to detect the small number of bacteria present there. Current technology allows researchers, like me, a way to see what bacteria are in a urine sample by looking for bacterial DNA. Unfortunately – since bacteria are everywhere – there’s also contaminating microbes in the air and on the materials used to collect and process the sample. We’re working with such low amounts of microbial DNA, that the bacteria of interest cannot easily be distinguished from contaminants in the sample.
One of the ways my lab tries to tackle this problem, is to analyze samples that consist of a known microbial community – referred to as a “mock” community. We take this mock community and analyze it at varying dilutions, so any bacteria present in those samples that is NOT part of the known community is therefore a contaminant. This type of approach has been described in a recent publication from our lab. Here the sequences in color are from bacteria that are expected to be in the mock community, while at higher dilutions, there is higher number of contaminating sequences.
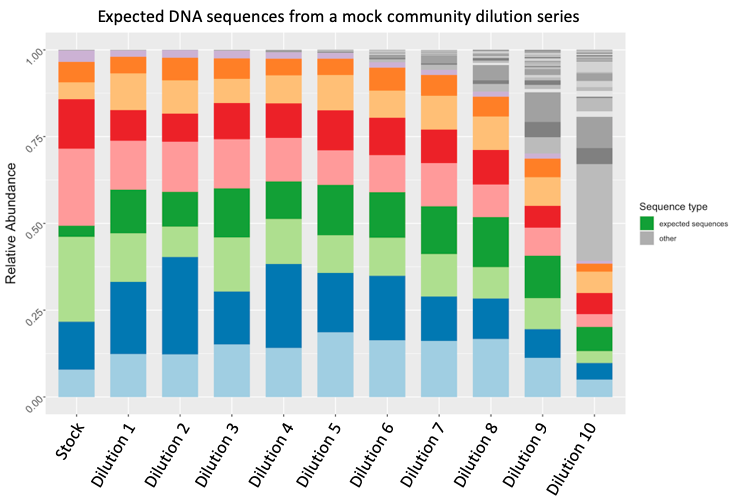
Mock community dilution series. Expected bacteria are shown in color, while contaminants are shown in greyscale.
The information we gain from establishing contaminants using the mock community data informs how we process and analyze our urine samples. My lab often tries many different ways to handle the mock community, so it’s important that the analysis be documented and reproducible. To address this, I decided to generate a data package using a tool created by the Open Knowledge Foundation. Here is my experience creating a data package of our data, the metadata, and associated software.
1unless actively infected, like a urinary tract infection.
The data and data package
I took the mock community commercially available from Zymo and diluted it 10 times. I sent the samples off to be sequenced at another lab, and received hundreds of files with each sample’s DNA sequences in return. As it stands, there is not a good way for me to create a data package using the raw sequencing files, so I decided to continue on with my data processing before generating the data package.
I gathered all of the information from the sequencing files and put them into R to pre-process the data with DADA2. Using DADA2, I assessed the quality of the data as well as got rid of any DNA sequences that were not associated with bacteria. DADA2 also uses a reference database of microbial DNA sequences to assign which bacteria is present in what sample.
The output of DADA2 is a special object in R called a phyloseq object, shown below. This object is essentially a collection of data frames, or tables, that can work together using the program Phyloseq. Phyloseq is very convenient because it has many built-in functions to explore sequencing data from communities of bacteria, like this mock community.
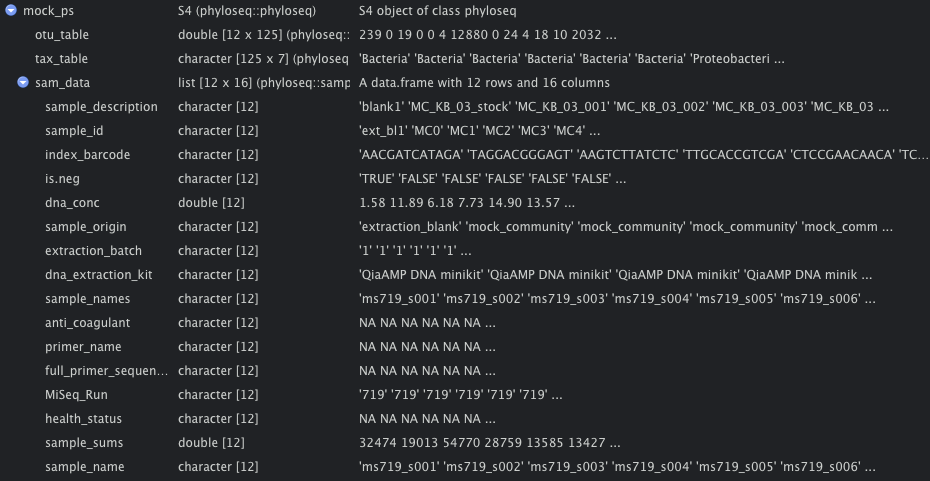
Phyloseq object with the other dataframes inside of it.
The phyloseq object for the mock community has 3 main parts: otu_table, tax_table, and sam_data.
- otu_table – table of the DNA sequences for each sample
- tax_table – table of the taxonomy of the bacteria in each sample
- sam_data – table of metadata for all of the samples
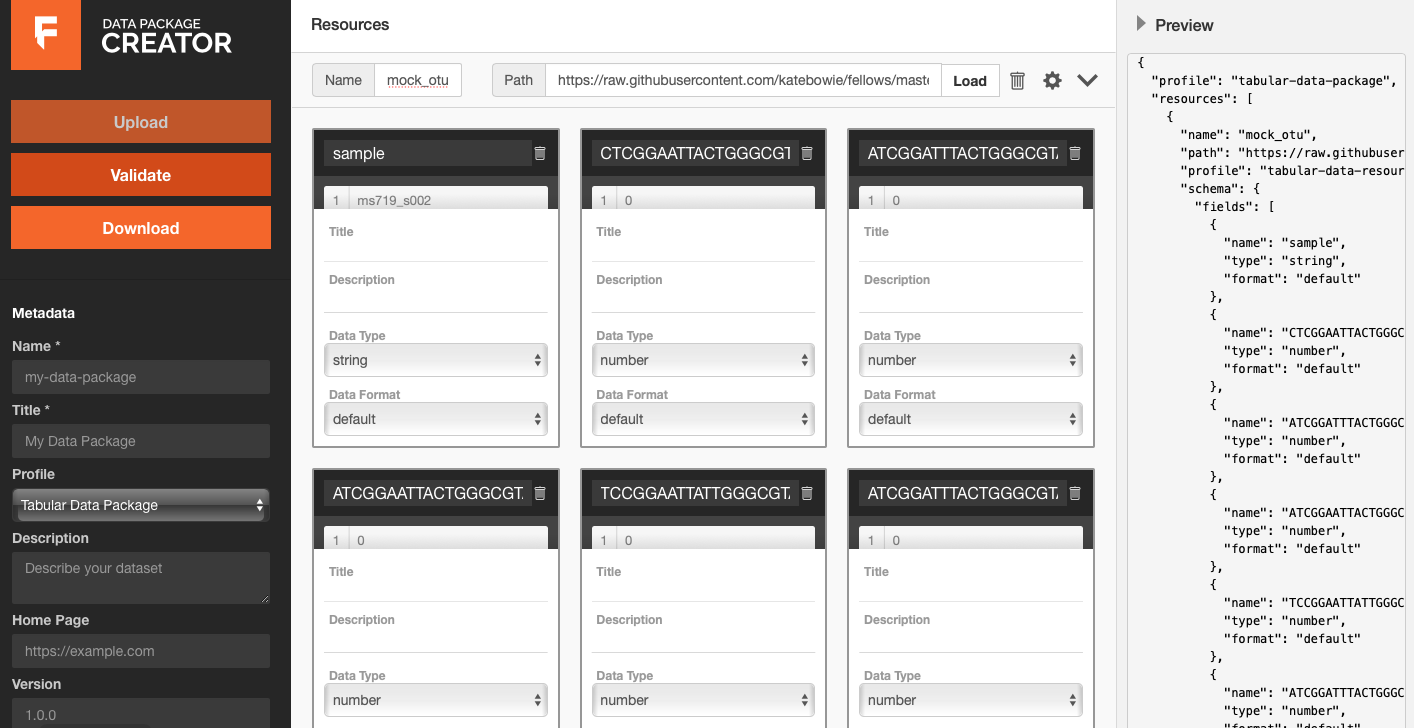
Unfortunately, the data package creator cannot take extract information from phyloseq objects yet. I could manually input all of the information from the phyloseq object into the creator, however that is very time consuming. Instead, I decided to export each part of the phyloseq object (otu_table, tax_table, sam_data) as a .csv file. This way, I could use the .csv files to fill in the categories for the data package creator but still upload the phyloseq object with my datapackage. Below is an example of using the data package creator tool with the otu_table:
Since I have already started processing this data, I have also uploaded the scripts I used. You can find the finished data package on my github.