Trading Data
Introduction
Our most recent Fricitonless Fellows project is to trade data and create a Data Package using another Fellow's data. I traded data with the fabulous Melvin! Melvin is a pathologist and soil scientist - learn more about Melvin and her research on her blog.
Getting and Cleaning the Data
While this seems like a fun project, I was frustrated at first. I had to find my partner's data. After reading her Data Package Blog and poking around on GitHub, I could not find her data. I eventually realized: we are mimicking the process of reusing reproducible research data. The first hurdle any researcher must overcome is finding the data. After consulting with Melvin, I was able to locate her data on GitHub and download it.
A screenshot of Melvin's original dataset.
Being a data librarian, I did not expect to be able to interpret Melvin's scientific data. I was correct. Even though I can not interpret the data, I can clean and validate it using Fricitonless tools. The dataset did not meet Tidy Data principles, so I took the opportunity to practice a bit of data cleaning. I gave my best attempt at making the data tidy.
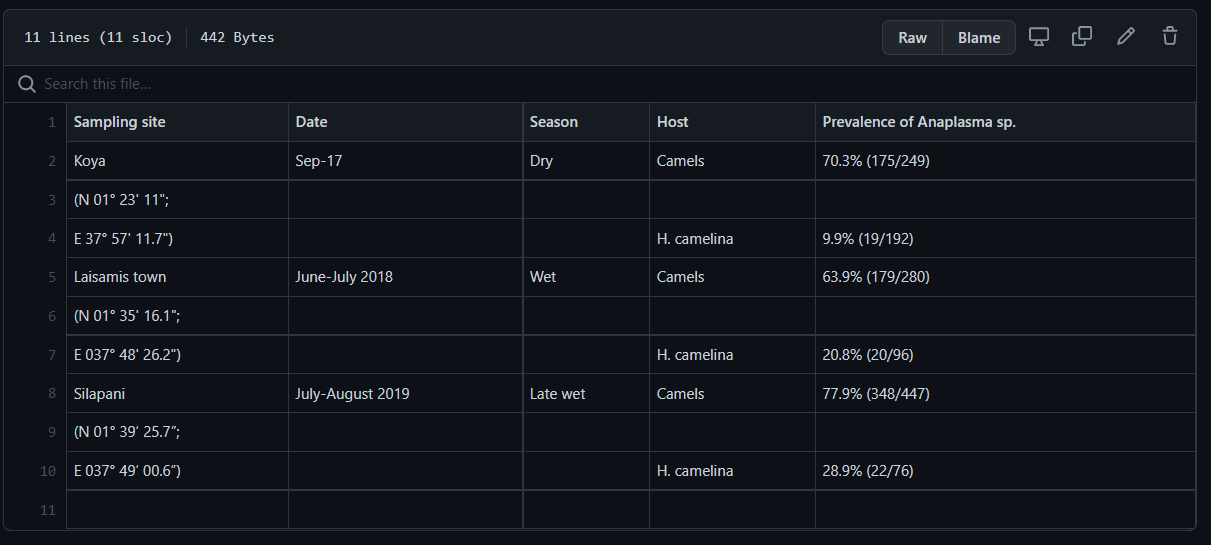
A screenshot of Melvin's dataset after Lindsay cleaned it using Tidy Data principles.
I mentioned cleaning the data to Lilly at our biweekly Fellows check-in meeting. She recalled another version of Melvin's data, and we looked together on GitHub and found it.

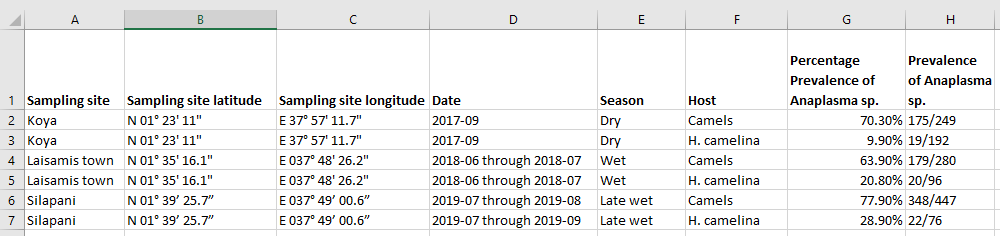
A screenshot of Melvin's clean dataset.
Comparing Melvin's clean dataset with the version I had attempted to clean, it is easy to see how someone with a social science background might interpret data differently than someone with background in the hard sciences. The original dataset had the location name and latitude and longitude coordinates in the same column. When I separated them, I separated the latitude from the longitude. In Melvin's clean dataset, the latitude and longitude are isolated into one column, which makes a lot more sense than listing them individually.
I made a few more revisions so that my version of Melvin's dataset looked more like her version of data. I did choose to separate the percentage of prevalence from the ratio of prevalence, and I standardized the date format using ISO 8601. Frictionless tools can be used to Transform Data using python. Since the dataset is so small, I manually cleaned it.
Data Package
Once I had identified the correct dataset and cleaned it, I was able to upload it to the Data Package Creator without issue. I then moved over to Goodtables to validate the data. I had many errors. First - I forgot to remove the metadata about the dataset from the json file the Data Package Creator had generated. Whoops! It took a couple of attempts to correctly modify the json file, and then I received 22 "Type or Format Errors."
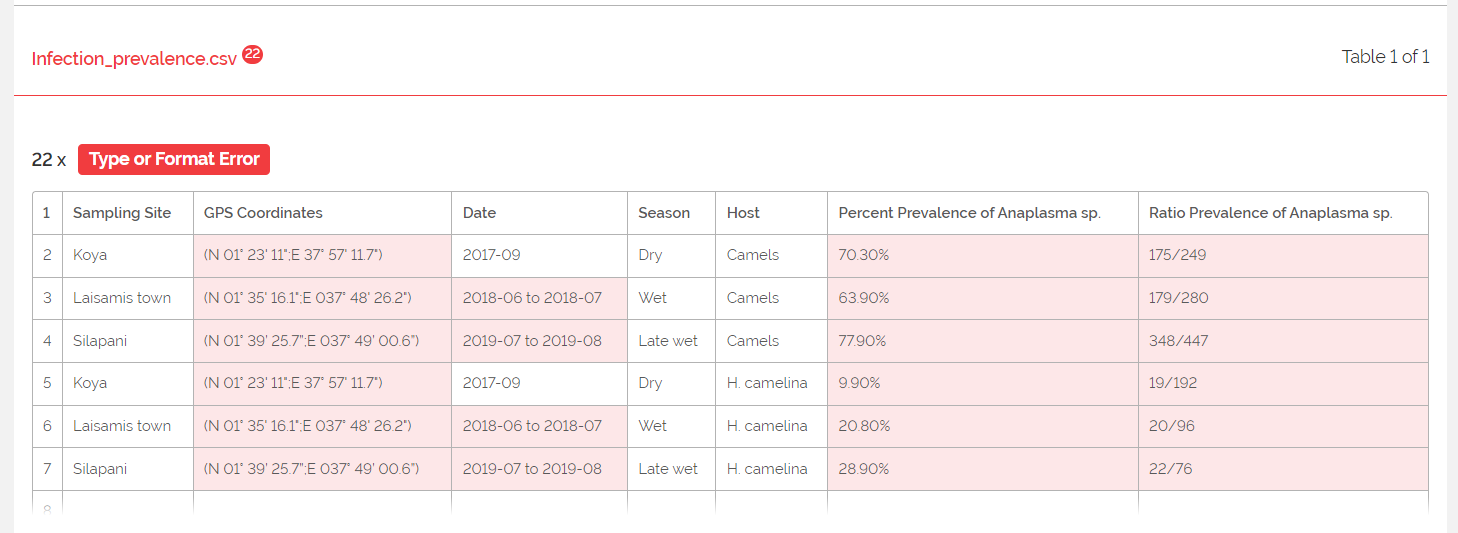
A screenshot of the Format Errors.
I had labeled the "GPS Coordinates" column as a "geopoint" as the type of data. I'm not sure the correct format for a geopoint, but it must be different than the way I had organizd the lattitude and longitude. Additionally, although I had used ISO 8601 to standardize the date formats, some of the data were collected during a date range rather than on a specific date. I received errors for the date ranges as well. Finally, percentages and ratios are not integers. My social science brain views an "integer" as simply a "number." Integers are whole numbers. I also needed to change the data type on those columns. Once I revised the json file, I had a valid table.
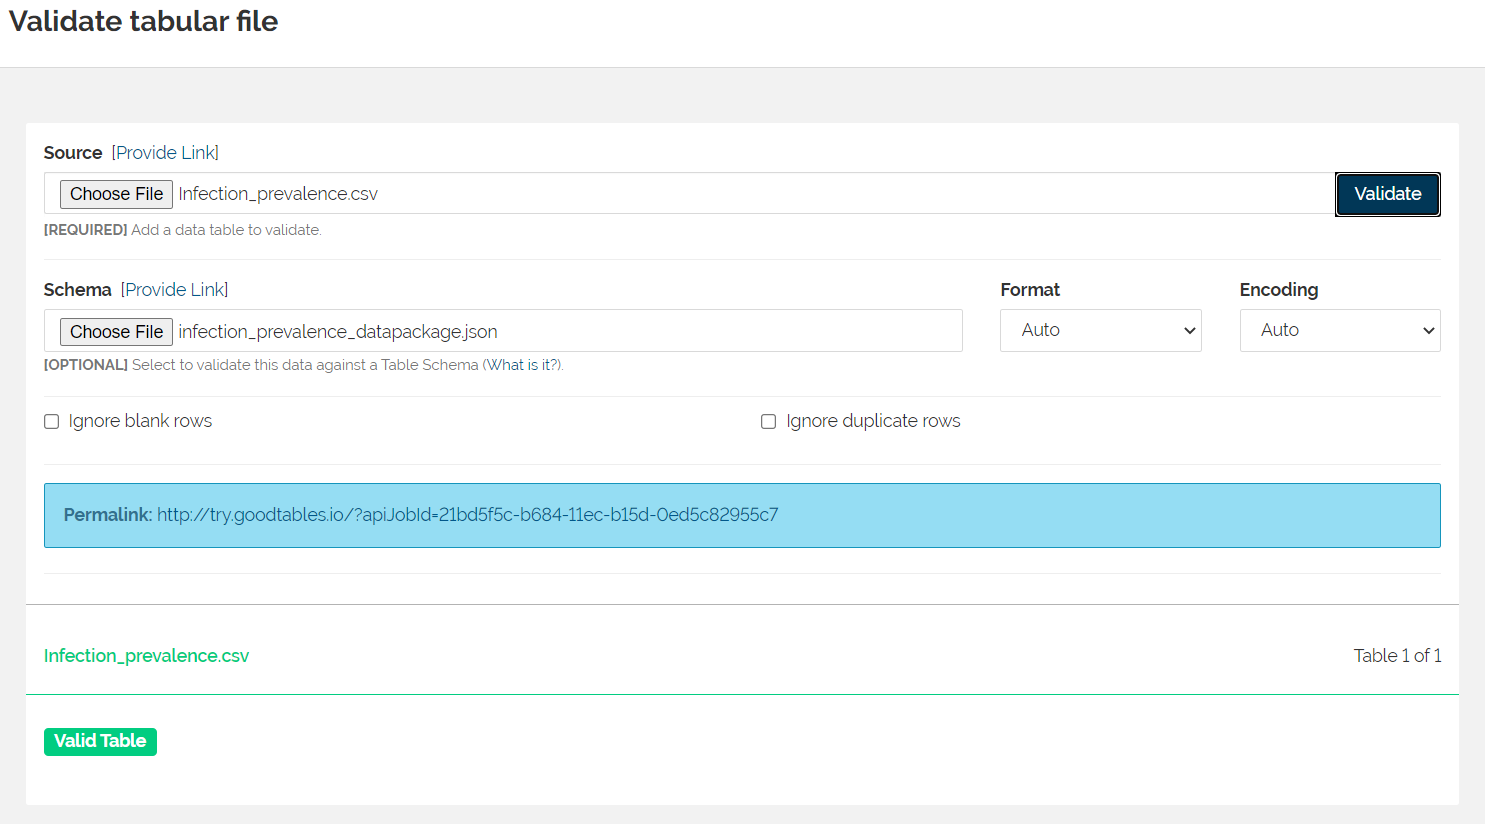
A screenshot of the validation from Goodtables.