Neuroscience Blog
This blog post is the first in an upcoming series of posts showing how researchers can use Frictionless Data tooling and specs in their workflows to make their own scientific data more reproducible.
Since I am a neuroscientist, I decided to start this tutorial series by examining published neuroscience data. By the end of this tutorial, you will know how to use Frictionless Data tooling to 1) package raw, open neuroscience data and it's associated metadata into a data package, and 2) validate that datapackage. These two steps are very helpful for creating data that is 1) understandable, 2) clean, 3) sharable, and 4) reproducible. Let's get started!
Getting the Data
The data I used here is published in eLife and has a CC-BY-4.0 license (meaning we are free to reuse the data). We could have found data from open neuroscience repositories, but I thought it would be fun to look at data from a paper. I picked this paper for a few reasons. First, I was looking for a neuroscience paper, and I researched Drosophila during my PhD, so I have a fond spot for Drosophila data. Second, I chose eLife because I like how their articles have the data behind figures easily linked with the figure. Having the data so easily accessible is a big win for reproducibility! Here is the paper I am using https://elifesciences.org/articles/42690: Transsynaptic interactions between IgSF proteins DIP-α and Dpr10 are required for motor neuron targeting specificity. Ashley et al, 2019. https://doi.org/10.7554/eLife.42690.001. For the purposes of this blog, I chose to examine the data from Figure 2: https://doi.org/10.7554/eLife.42690.006. By the way, it is super cool that eLife has DOIs for their figures! We can download the data straight from Figure 2. We should also look for a data dictionary or any other information about the data. For instance, in a manuscript, there might be important information in the methods section. When we open the data, we find (uh oh) the data is in a table in a Word doc. This is pretty common! And at least the data is available! We will have to do a little bit of work to use this data. We need to take the data and save it as a csv (there are several ways to do this - I copied the data into a Google Sheet and then download it as a csv file.) Now that we have our data, let's take a look at it (always a good idea). We see that first column has lots of missing values. It is denoting which panel in the figure is represented, which is information we don't need for this purposes of this blog, so let's just delete that column for now. Now we're ready to start using Frictionless Data!
Create a Data Package
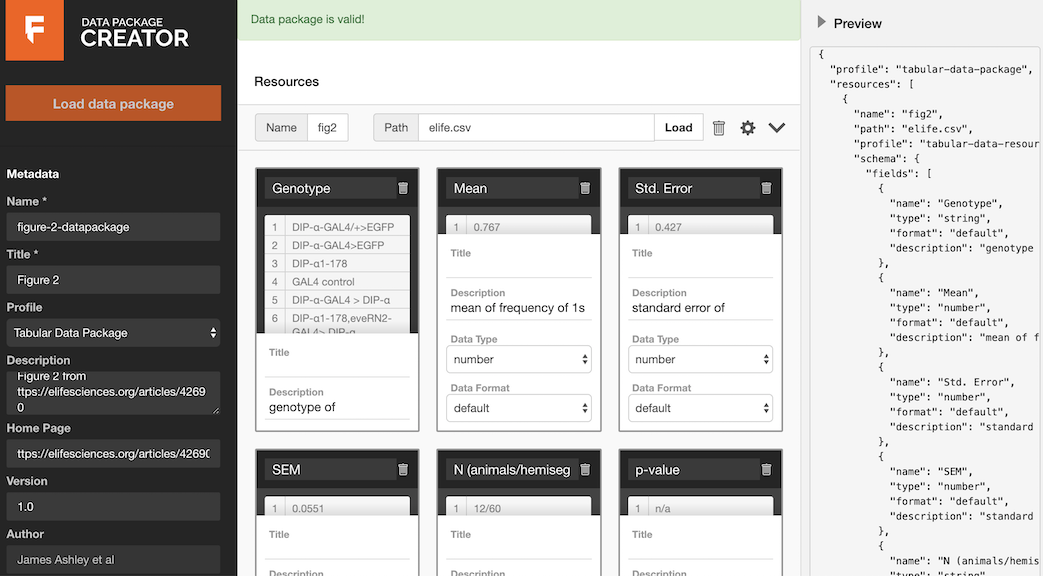
We'll first start by creating a Data Package, which is a container of the raw data, it's associated metadata, and optionally a schema. You can read more about the specifications of the Data Package here. We have two ways of creating and working with Data Packages. The first is with the browser tool datapackage creator, and the second is programmatically with the datapackage libraries. We'll start with the first. Here are the steps: Note: if you get lost, check out the more in-depth tutorials on our Field Guide.
- We will load our recently saved data (in the .csv format) into the datapackage creator.
- Add in as much metadata as possible, like a description of what the data is
- Change the pre-loaded data types to be accurate (in this case, integer to number & the others should be strings)
- Look up the license - eLife is CC-BY by default
- Make sure to credit the authors & link back to the article or data with its DOI
- Then hit the 'Validate' & 'Download' buttons when you are done
You now have the data in csv format & its json-formatted schema & metadata as a datapackage!
Here is an image of what your browser should look like once you have completed these steps:
Advanced: We can also create and use datapackages with Python (and other languages). See examples in the readme here, and the docs here http://frictionlessdata.io/docs/creating-tabular-data-packages-in-python/ and here http://frictionlessdata.io/docs/using-data-packages-in-python/. Very briefly, here is an example of using the Python datapackages library, running in the command line.
Inside your terminal, navigate to the folder containing your data, and type:
>>> from datapackage import Package

#Create an empty package
>>> package = Package()

#infer the JSON metadata + schema from our csv data & save it
>>> package.infer('elife.csv')
>>> package.save('datapackage.json')

#let’s look at the information in our datapackage
>>> package.descriptor['resources']
[{'name': 'resource1', 'profile': 'tabular-data-resource', 'path': 'elife.csv',
 'schema': {'fields': [{'name': 'Genotype', 'format': 'default', 'type': 'string'},
 {'name': 'Mean', 'format': 'default', 'type': 'number'}, {'name': 'Std. Error',
  'format': 'default', 'type': 'number'}, {'name': 'SEM', 'format': 'default',
   'type': 'number'}, {'name': 'N (animals/hemisegment)', 'format': 'default',
   'type': 'string'}, {'name': 'p-value', 'format': 'default', 'type':
   'string'}], 'missingValues': ['']}}]

#note: this is json, so we can parse it
#we can also work with the data using this library, for instance,
#let’s see the genotypes of all the flies that have a mean less
#than 10 (hint, it’s all of them)
>>> print([e['Genotype'], float(e['Mean']) for e in package.resources[0].read(keyed=True) if float(e['Mean']) < 0.6])
[('DIP-α-GAL4>EGFP', 0.0), ('DIP-α1-178', 0.0), ('Elav-GAL4>DIP-α', 0.0),
('Mef2-GAL4>DIP-α', 0.0), ('Elav-GAL4 >UAS-DIP-α RNAi', 0.567),
('Mef2-GAL4 >UAS-DIP-α-RNAi', 0.429)]
Great! Now, What can we do with our new Data Package? It is almost ready to be reused by someone else! First, we should validate it.
Validation
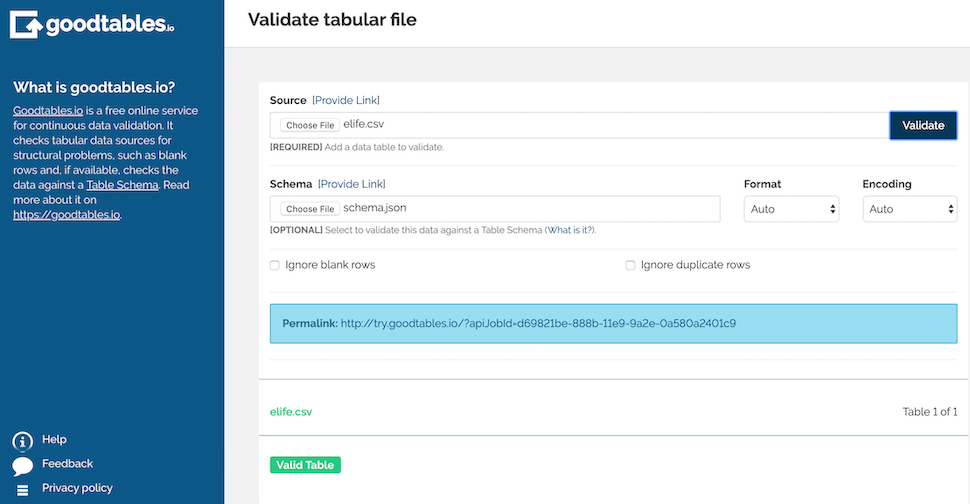
Why would we validate our data? What if we were working within a group & many people were making changes to the dataset? It would be good to make sure that no errors were introduced into the data after each change. Also, validation helps us clean the data - say we want to get rid of all the rows with blank cells, this would help us identify those rows. It also lets us double-check our data types & quickly find any errors. We can use the Frictionless Data browser tools http://try.goodtables.io/ & http://goodtables.io/ and Advanced users can validate using the command line. First, we will use http://try.goodtables.io/. Again, this is brief, so if you get lost, check out the Field Guide. Here are the steps:
- We can validate without a schema in case we don’t have one
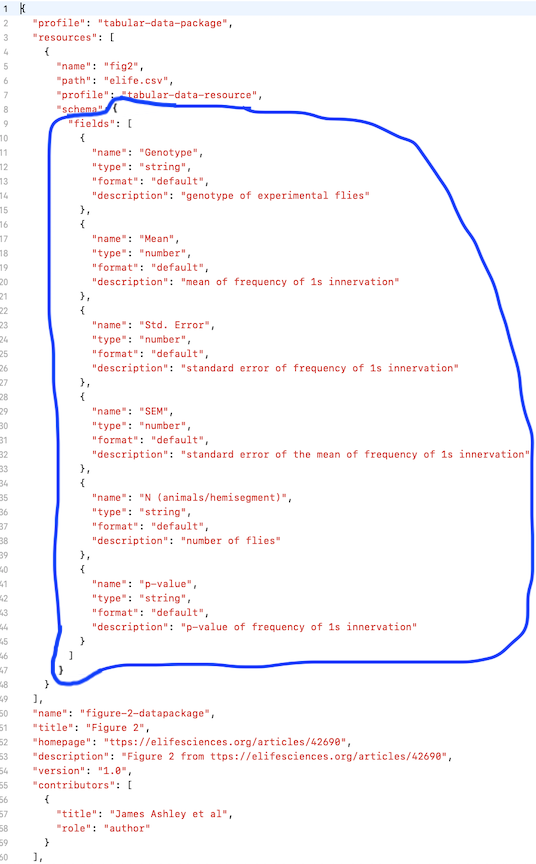
- Or we can use our schema we just made! (We can also use a predefined schema if we/our team has one.) First we need to access the schema from the datapackage.json.
- We want everything inside the schema brackets, and nothing else (see blue circle on the next pic). Take that & save it in a separate file as schema.json & then load that into goodtables in the schema area & hit validate.
Take the JSON in blue & save it as schema.json:
Validated csv:
- What does it look like when it is invalid? Let’s open up our schema.json again & change the type for Genotype from “string” to “number”. Hit save & reload into goodtables. Now when we validate, we see a type error for the genotype column.
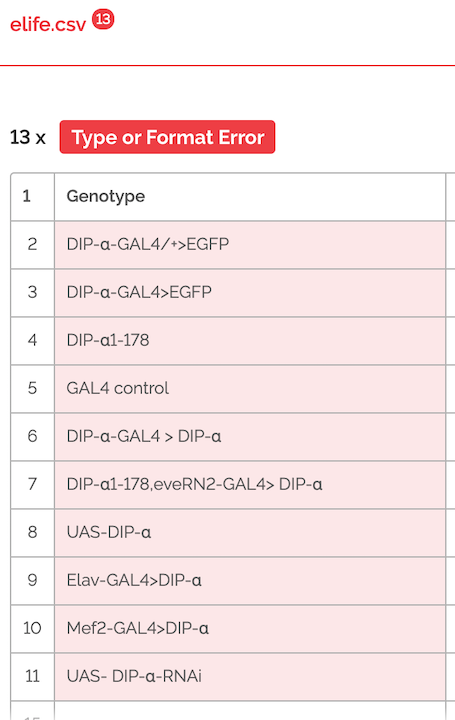
This is useful because, say we have designed a schema previously so that all genotypes will be strings, but we then get data that has genotypes typed as numbers accidentally. We would be able to catch that error here quickly with goodtables. As a real world example, Excel famously changes genes like 'SEPT7' to the date September 7th, without telling users. Genetics studies have been published where researchers didn't realize this data conversion had happened, so their results were incorrect! (Here is a short blog about this.) Validating your data can save you from this type of conversion error.
Advanced: Let’s validate using the command line. Inside your terminal, navigate to the folder containing your data & then type:
goodtables elife.csv
(replace elife.csv with your data file name).
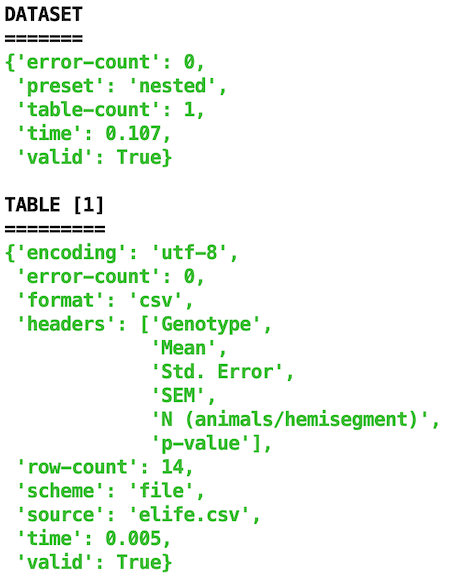
Example output:
Advanced 2: Validate with Python goodtables library (https://github.com/frictionlessdata/goodtables-py; http://frictionlessdata.io/docs/validating-data/)
>>> from goodtables import validate

#validate without a schema
>>> report = validate('elife.csv')
>>> report['valid']
True

#validate with a schema
>>> report = validate('elife.csv', schema='schema.json', order_fields=True)
>>> report['valid']
True

#what happens when we validate an invalid csv file?
>>> report = validate('elife_invalid.csv')
>>> report['valid']
False

#let’s look at the number of errors
>>> report['error-count']
4

#now let’s look at those error messages
>>> report['tables'][0]['errors']
[{'code': 'missing-value', 'row-number': 2, 'message-data': {},
'message': 'Row 2 has a missing value in column 6', 'column-number': 6},
{'code': 'missing-value', 'row-number': 5, 'message-data': {},
'message': 'Row 5 has a missing value in column 6', 'column-number': 6},
{'code': 'missing-value', 'row-number': 8, 'message-data': {}, 'message':
'Row 8 has a missing value in column 6', 'column-number': 6}, {'code':
 'missing-value', 'row-number': 11, 'message-data': {}, 'message':
 'Row 11 has a missing value in column 6', 'column-number': 6}]

#this shows us that there are 4 missing value errors
You can also write custom validators (see this example and more from our GitHub repo readme:
report = validate('data.csv', checks=[
    {'custom-constraint': {'constraint': 'salary < bonus * 4'}},
])
Conclusions
To recap, we have created a datapackage to keep track of our raw data, our metadata, and our schema. Then, we learned how to validate that datapackage (validated our raw data using our schema). Now that we have nicely packaged, validated data, we can share it! We can share data many ways - from emailing to a colleague, to hosting on a repository, to publishing in an open access journal (like eLife where we got this data from!). Some open neuroscience repositories include OpenNeuro, G-Node, and CRCNS.
Going Deeper
In 2017, we did a collaboration with eLife where data from over 1000 eLife articles were validated with goodtables. Read the whole report here. Highlights include that many errors were found, with most being structural errors (blank rows, duplicate rows, and duplicate headers for example) and also lots of missing values. Many datasets were formatted for human readability, which often makes it really difficult to perform computation analysis of that data. This is one of the reasons why it can be hard to reproduce other people's work, so it is important to think about when sharing your own data.