Packaging Soil Mositure Data
Constantly under the impression that I’m six months behind on lab work, I am capital Q - Queen - of bad data practices. My computer is a graveyard of poorly labeled .csv files, featuring illustrative headers such as “redo,” “negative pressure why?” and “weird - see notes.” I was vaguely aware of the existence of data packages, but like learning Italian or traveling more, implementing them in my workflow got slotted in the category of “would be nice if I had the time.” That clemency, however, was not extended to my research lifeblood - molecular spectroscopy databases, you disorganised beauties you - nor to collaborators who often invoked the following feeling:

Particularly in fields where measurables aren’t tangible macro concepts (see: population) but abstract and insular conventions with many varied representations, clear descriptors of multivariate data are a must in order for that data to be easily used and reproduced. This is where data packages come in; they bundle up your data with a human and machine readable file containing, at minimum, standardised information regarding structure and contents. In this lil’ post here, we’re going to walk through this process together by packaging data together with its metadata, and then validating the data using Frictionless tools.
Get that data!
I’ve recently gotten involved with a project monitoring agricultural regeneration through remote sensing. One important soil health parameter is soil moisture, relevant on its own, but additionally in how it ties into drought prediction and food security monitoring. The data is measured by SMAP, a passive microwave orbiting observatory from the acronym loving institute, NASA. As a government agency, NASA doesn’t license the use of NASA materials or sign licensing agreements, but instead asks kindly not to use their data for weird merchandising stuff; the SMAP data products are therefore openly available from the National Snow and Ice Data Center. You can select a relevant region and time series and bulk download the data via HTTPS. For our team, the data then undergoes external preprocessing and a downconversion process, via external partners, before coming to us, looking like:
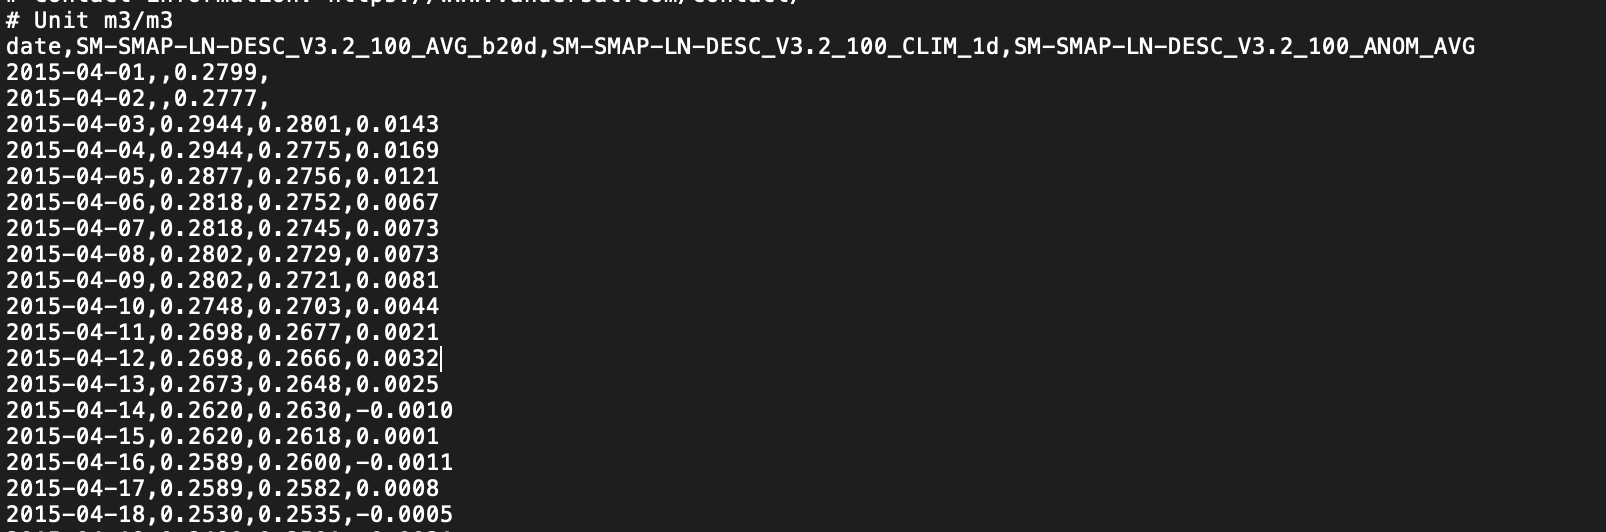
Not bad so far! At an initial glance, we can see that the date column is in a reasonable format, there is a header containing units, and it doesn’t seem like there are missing values. Let’s put it through the data packaging process and see what happens.
Pack it up!
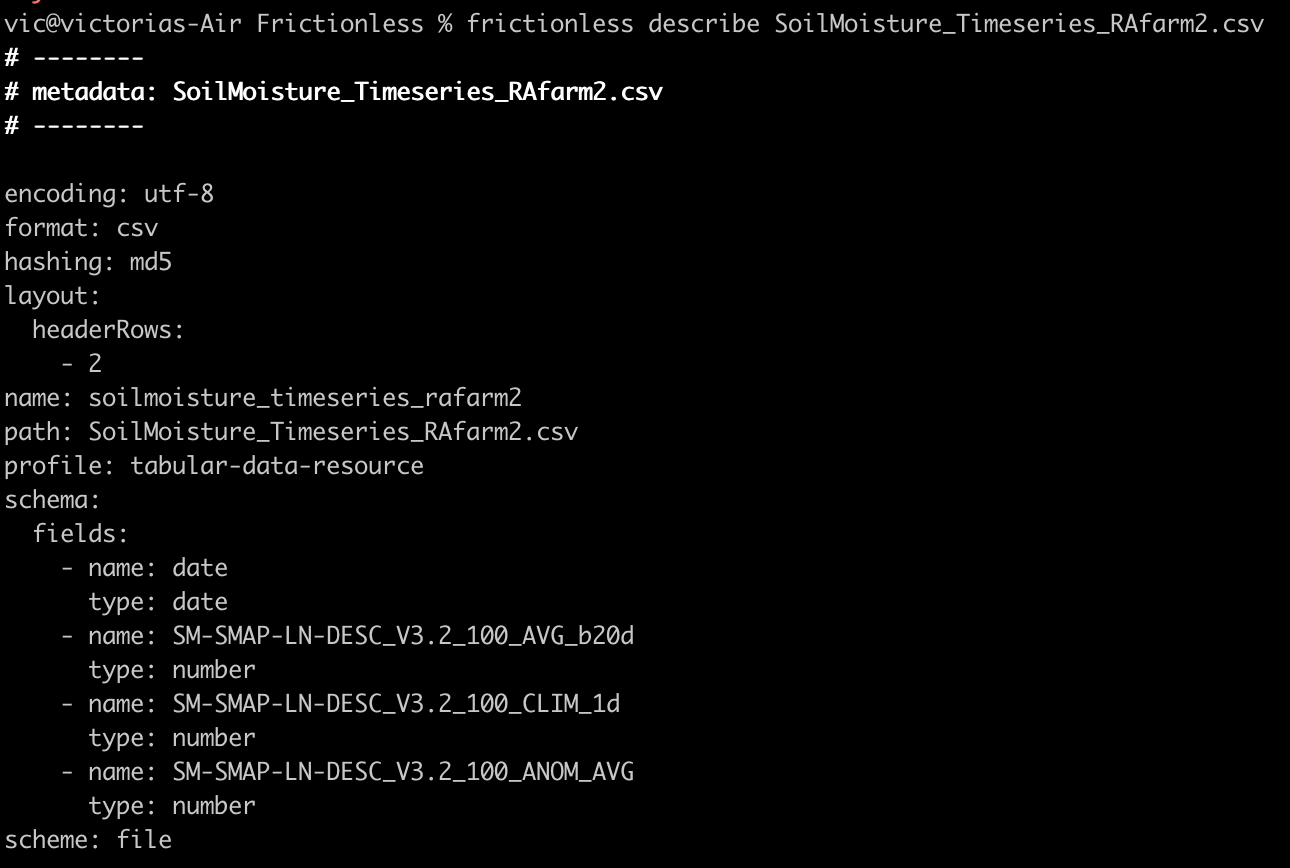
Frictionless has a browser tool for creating data packages but for a slightly closer look under the hood we’re going to play with the Frictionless Tools a bit. The function describe, for example, can be used to describe data and generate metadata, which contains information such as type (integer, string, etc), constrains (min, max etc.) relations, and so forth. Yes - much of this can be inferred by investigating the tabular data itself, or is included in the csv header, but having properly described data saves a lot of upfront workflow effort, and potentially many grim hours of starring at unlabelled gridded numbers. In the command line describe, spits out a YAML file where it infers several data parameters.
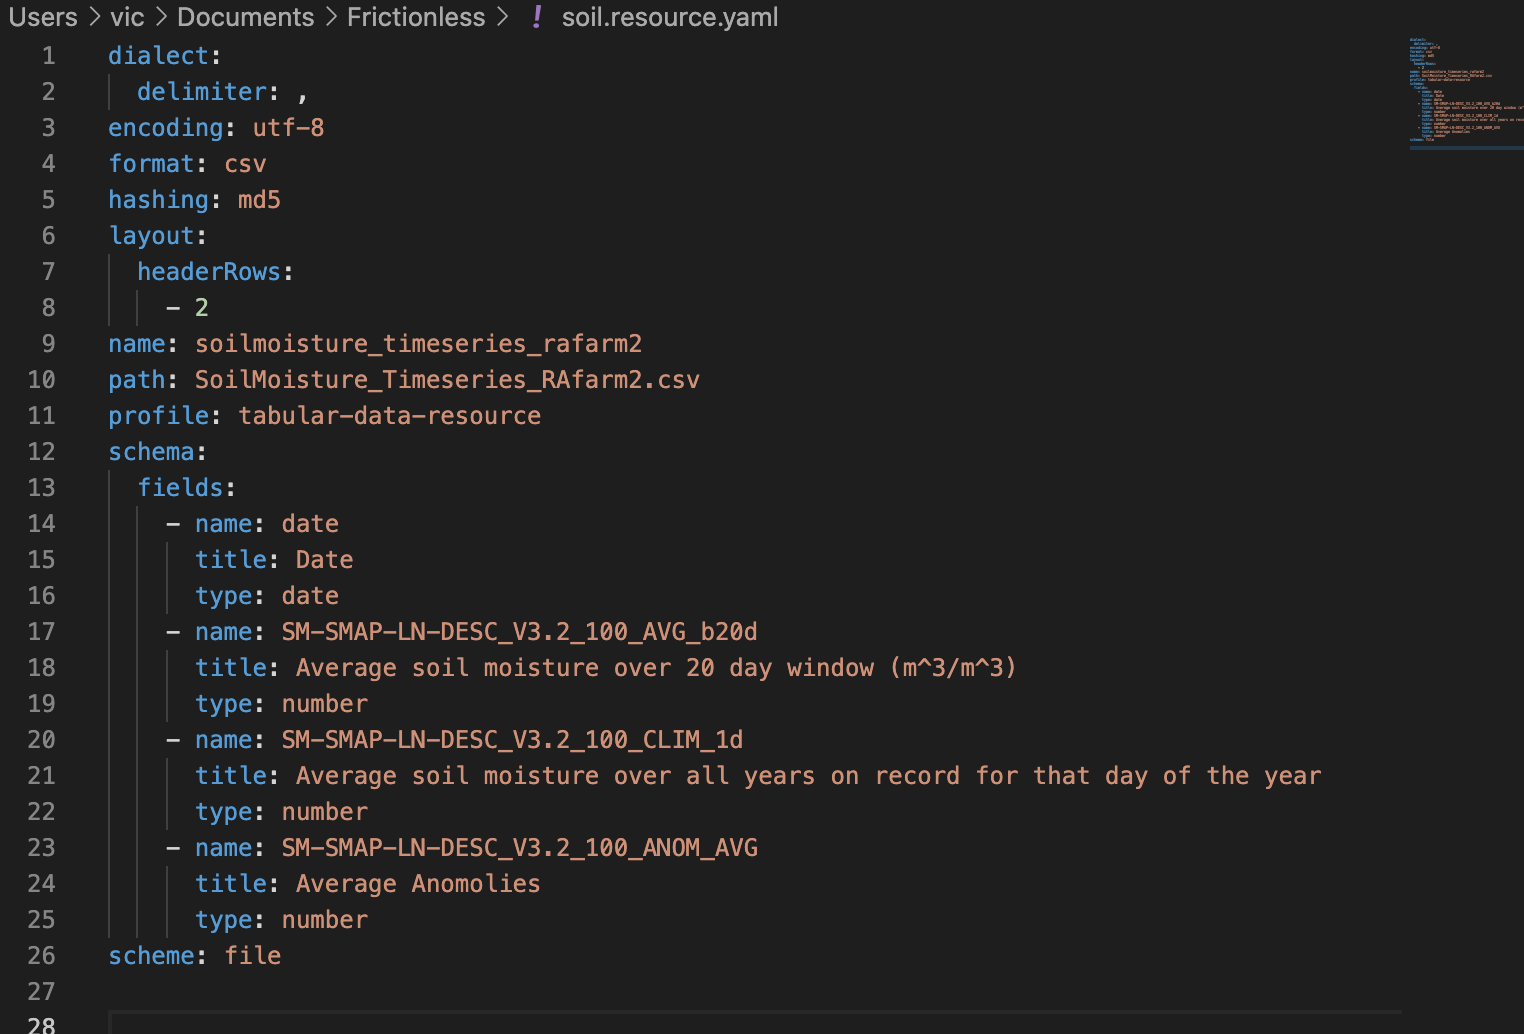
It is, in this case, admittedly a little barebones. So I opened the file and tried and flush things out, going off suggestions given via the Frictionless Standards (Data Package | Frictionless Standards ) for data packages. It didn’t take me long to figure out that I had no idea what the column names meant. Some measures of volumetric soil moisture, given in m^3/m^3, for sure. But the full naming convention eluded me so I went on the hunt. NASA has loose bits of documentation all over like such as:
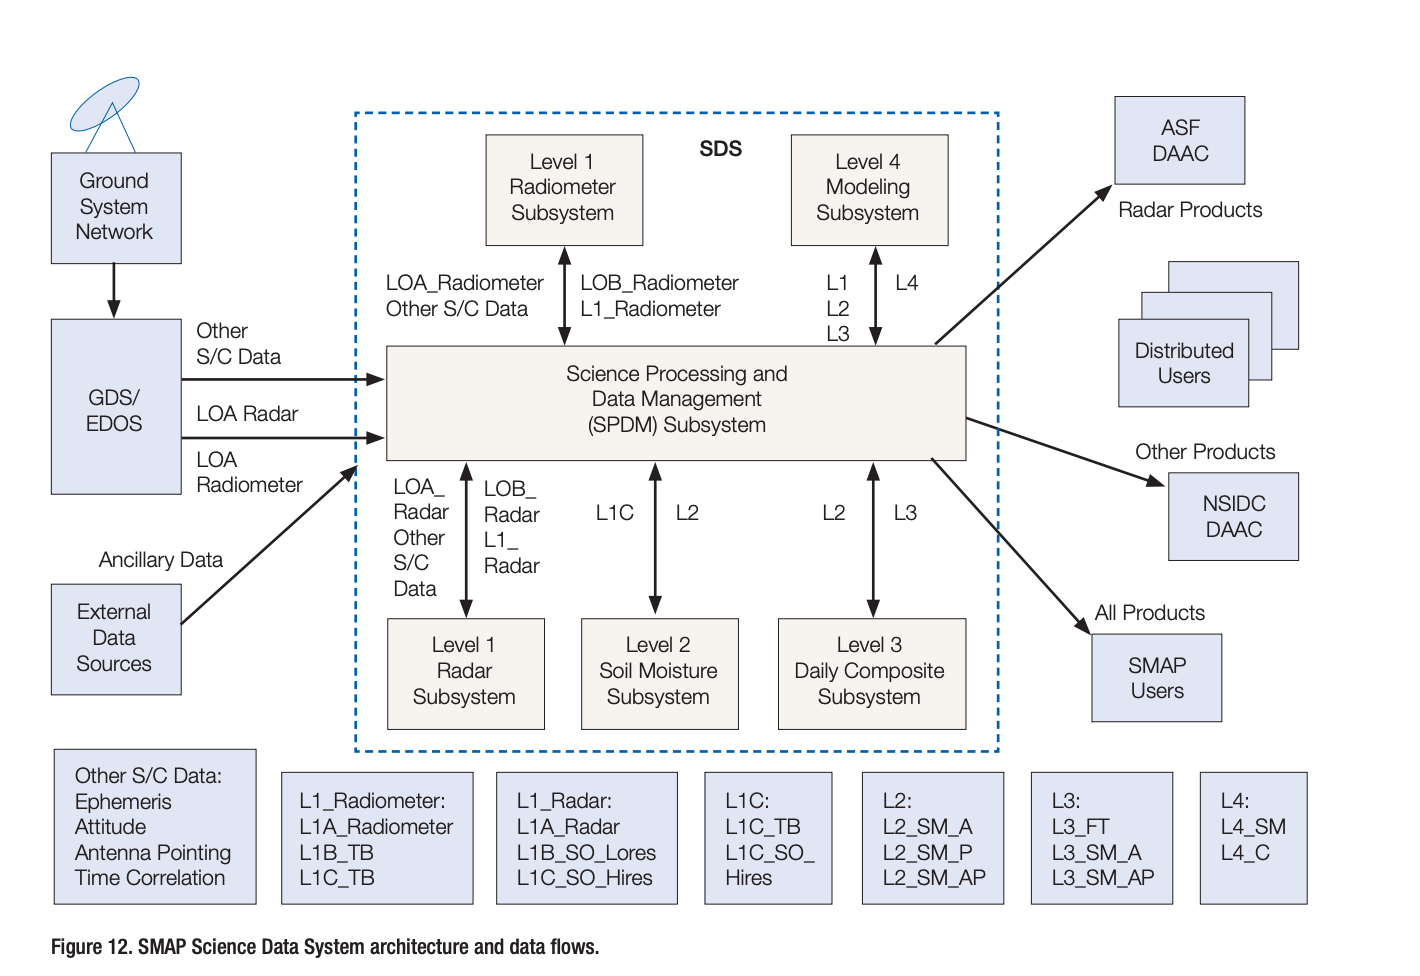
A couple things were easily inferrable; SM, for instance, was likely soil moisture, and SMAP - the name of the satellite. One hour into the worlds driest scavenger hunt, however, I had only determined L to indicate the satellite band and DESC to mean it was measured during a descending orbit. The rest was a mystery! At this point I sucked up my pride and emailed the data provider who cleared up what turned out to be internal naming conventions. AVG_b20d, for example, is the soil moisture average over a window of 20 days. This is done due to the volatility of daily observation. A meta rallying cry for metadata! I added the information into the YAML file, and made some other changes.
Cool. I decided it was time to try and validate the data, to see if there were any apparent problems I wasn’t picking up visually.
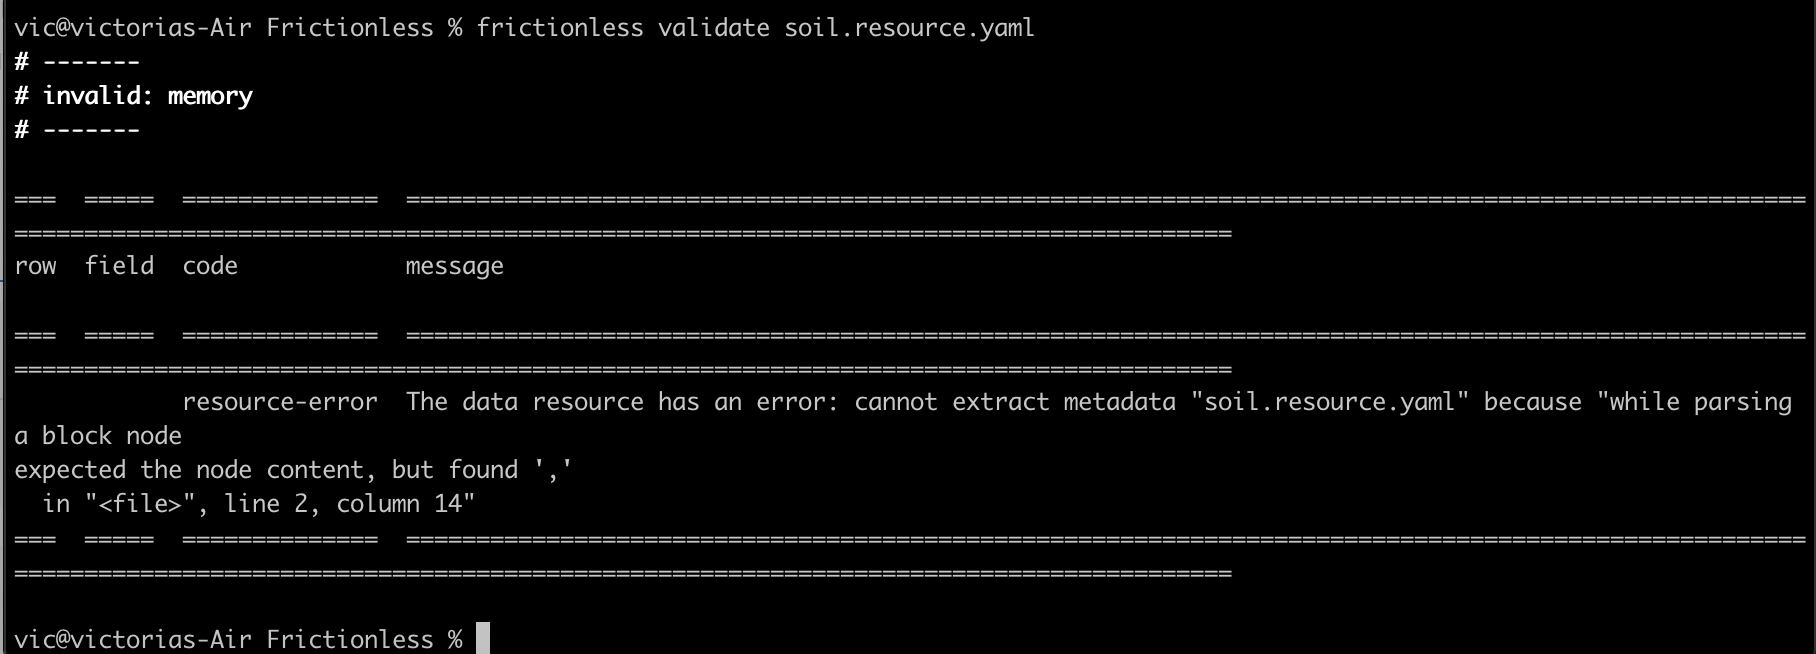
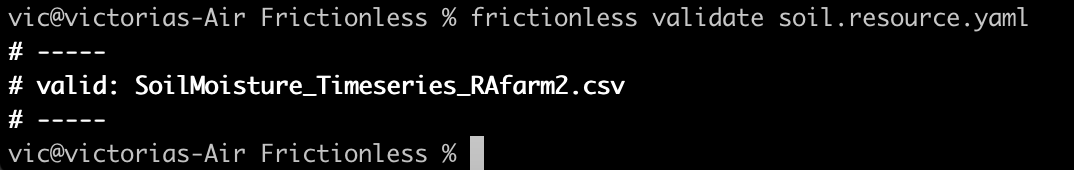
Oops! In my metadata zeal, I tried to manually change the dialect delimiter specification. Fixed it and everything looked golden.
This exercise, however got me thinking. Lots of information is still missing to properly make conclusions about soil moisture, such as a shape file or some other geographic specifier, an indicator giving the soil type, clarity on if this is a measurement of the top soil or an estimation of the root zone layer, etc. The data is in better shape now than when we started, but could still use additional specifiers to facilitate clear and reproducible analysis. At minimum, a data package contains a metadata file. Even better, metadata + the data itself. Better yet, you add a README.md file! Learn more here: https://specs.frictionlessdata.io/.