Reflecting on 'datafication', data prep, and UTF-8 with goodtables.io
I'm going to let you in on a not-so-unknown secret: I'm probably the least data-literate of the fellows. Half of the time, I'm wondering whether or not my rudimentary knowledge of python and R will be enough to complete the ambitious visualization that I've set out to make this year. But, I guess that's been the whole point of this project (and my fellowship with OKF): to learn and improve my own skillset, while working on a project that I'd been prototyping for a while before starting here. To be sure, I've learned a lot over the past few months, and hope that I'll continue to do so long after our fellows program.
As I always try to point out, anthropologists and sociologists write a lot about quantification and its dangers, but I would argue that only the latter has invested in the kind of data literacy programs that would allow them to translate between what often feel like diametrically opposed world views. While I could probably talk someone's ear off about the bias behind data, to be honest, I've never been the best at math!
Social scientists often think that they're the only ones with these critiques, but if there's anything I've learned throughout this fellowship: it's that this is definitely not the case. My cohort has enunciated a lot of the same tensions and fears that I've been exposed to throughout my (very short!) research career, but always end with how they can be rectified or mediated in real time. They immediately think about the interoperability, implicit bias, and replicability of a case study, and always check its technical specs and the studies it cites in turn. In many ways, they've made me realize that while these fears of bias and 'datafication' are clearly not the domain of writers and academics alone, there's not nearly enough reporting or translation being done about how people are actively trying to rectify these critiques in real time, and the solutions that are emerging from them.
It's a shame, because there have been many ongoing attempts to improve these processes, but writing about them usually isn't as interesting (or gets views or citations), unlike critique. Solutions journalism presents an interesting alternative to this, which I recently wrote about for The Graduate Press. But this too isn't black and white. There are definitely researchers out there that think that these tools can complement each other, and that mixed methods is a viable alternative to the binaries of 'qualitative' and 'quantitative' that researchers are usually forced to choose between.
During the first half of our program, I thought about these tensions a lot, and they would often come up at our group sessions. At the same time, we also did a lot of prep work for our projects: from thoroughly investigating what implicit assumptions behind 'open access' principles, to prepping the data tables that explain the terminology used within our respective data sets. Before I knew it, it was 2021, and revisiting my data in the new year has made me realize just how much time and efforts goes into cleaning, structuring, and formatting datasets – and how much more goes into making them understandable for others (i.e. through Frictionless' data-package). I'd always thought of these processes as a kind of black box, where 'data analysis' simply happens. But in reality, it's the fact that we've been spending so much time on preparatory work that points to how important these processes actually are: and how much goes into making sure that data can be used before analyzing it in the first place.
That's not to say that these processes are now entirely transparent for me. There is always a learning curve, even for the simplest of things, almost like learning a new language. For example, when I first uploaded my github repository to goodtables.io, I was totally confused by this error:
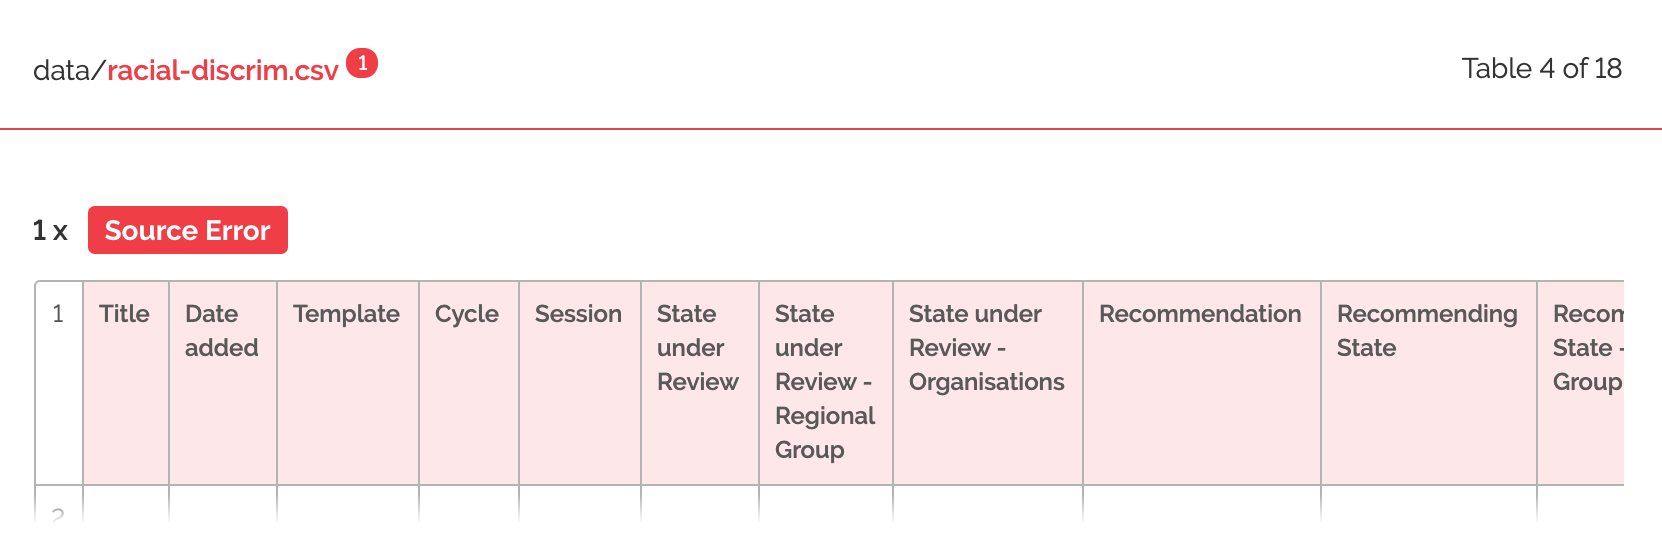
What is a 'source error', I wondered?
While I could see that 'source' was probably pointing to something fundamental about the datasets I've been using, I actually had no idea what the error meant. It was only after talking with Lilly, who said that this was pretty common, and that it may be because my data wasn't saved in the right format (as CSV UTF-8), that I began to think about what was going on.
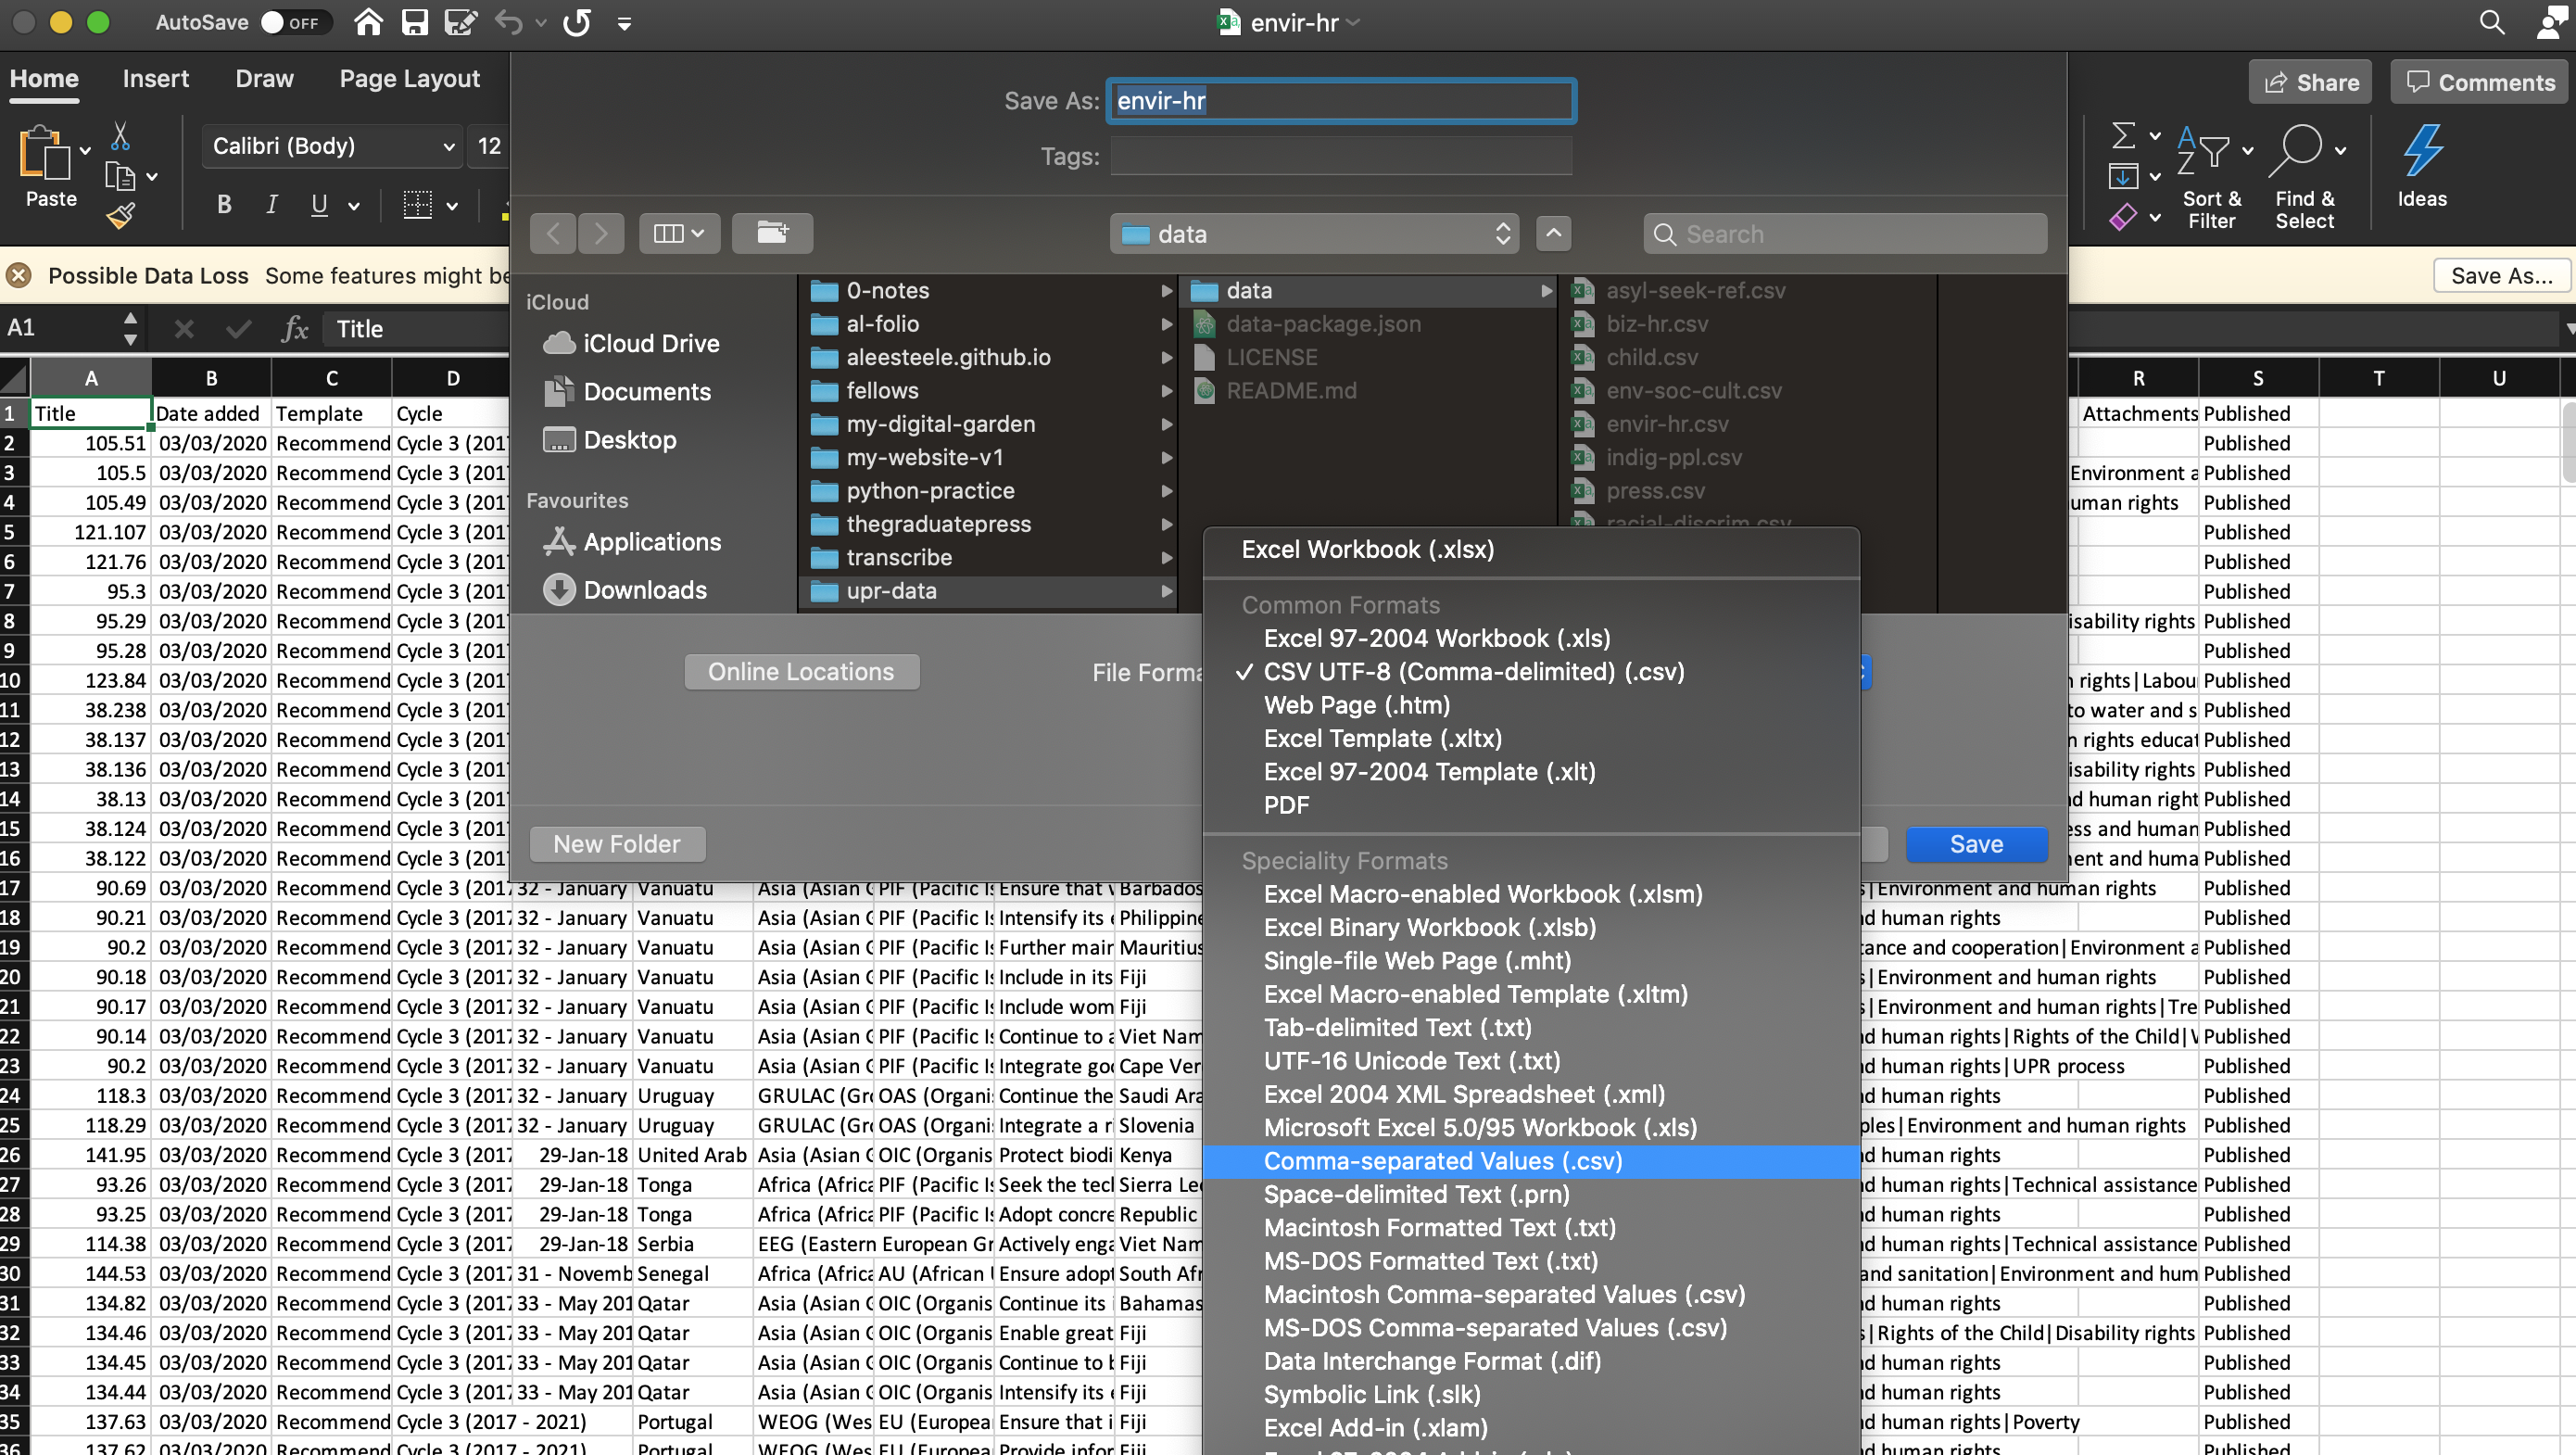
Saving the files as CSV UTF-8.
When Lilly said that encoding the data as 'UTF-8' was important, it sent me down a bender of trying to understand why. It turns out, UTF-8 encoding is a key reason why our devices can display multiple languages on web pages. Some have even called it "the most elegant hack" of its time. Essentially, UTF-8 allows web developers to solve a problem that first-generation programmers never considered, because programming languages – and programmers themselves – primarily operated in the English language.
When I discovered this the other day, I realized that the history of computation, and the tools that it requires, are full of these kinds of stories that simply get lost to non computer scientists like myself. These processes aren't at all linear, but are actually negotiated, and are building on each other all the time. Just because the debates about 'algorithmic bias' are ongoing today, doesn't mean that the problems that the original AI programmers hadn't considered in their first iteration aren't solvable: just look at Timnit Gebru's work AI ethics. Just because the open movement hasn't solved all the problems with institutional transparency and accountability that we'd originally thought it would, doesn't mean that solutions aren't possible, or at least in the works.
Eventually, maybe tools like goodtables.io will emerge to help researchers check the possible bias of a dataset, or ensure that a design will translate across disabilities. In fact, I'm pretty sure that tools like this already exist, and are slowly being adopted as universal standards. The data prep work that I've been thinking of as tedious (but just an inevitable part of the process) it itself a product of people trying to solve problems – just like what UTF-8 encoding did for rendering the world's languages. Maybe accounting for bias and context will become a part of data prep as well, some time in the future. Learning about the Frictionless Data format, and what data tables does for context, and what goodtables.io has done for formatting, has been a good start.
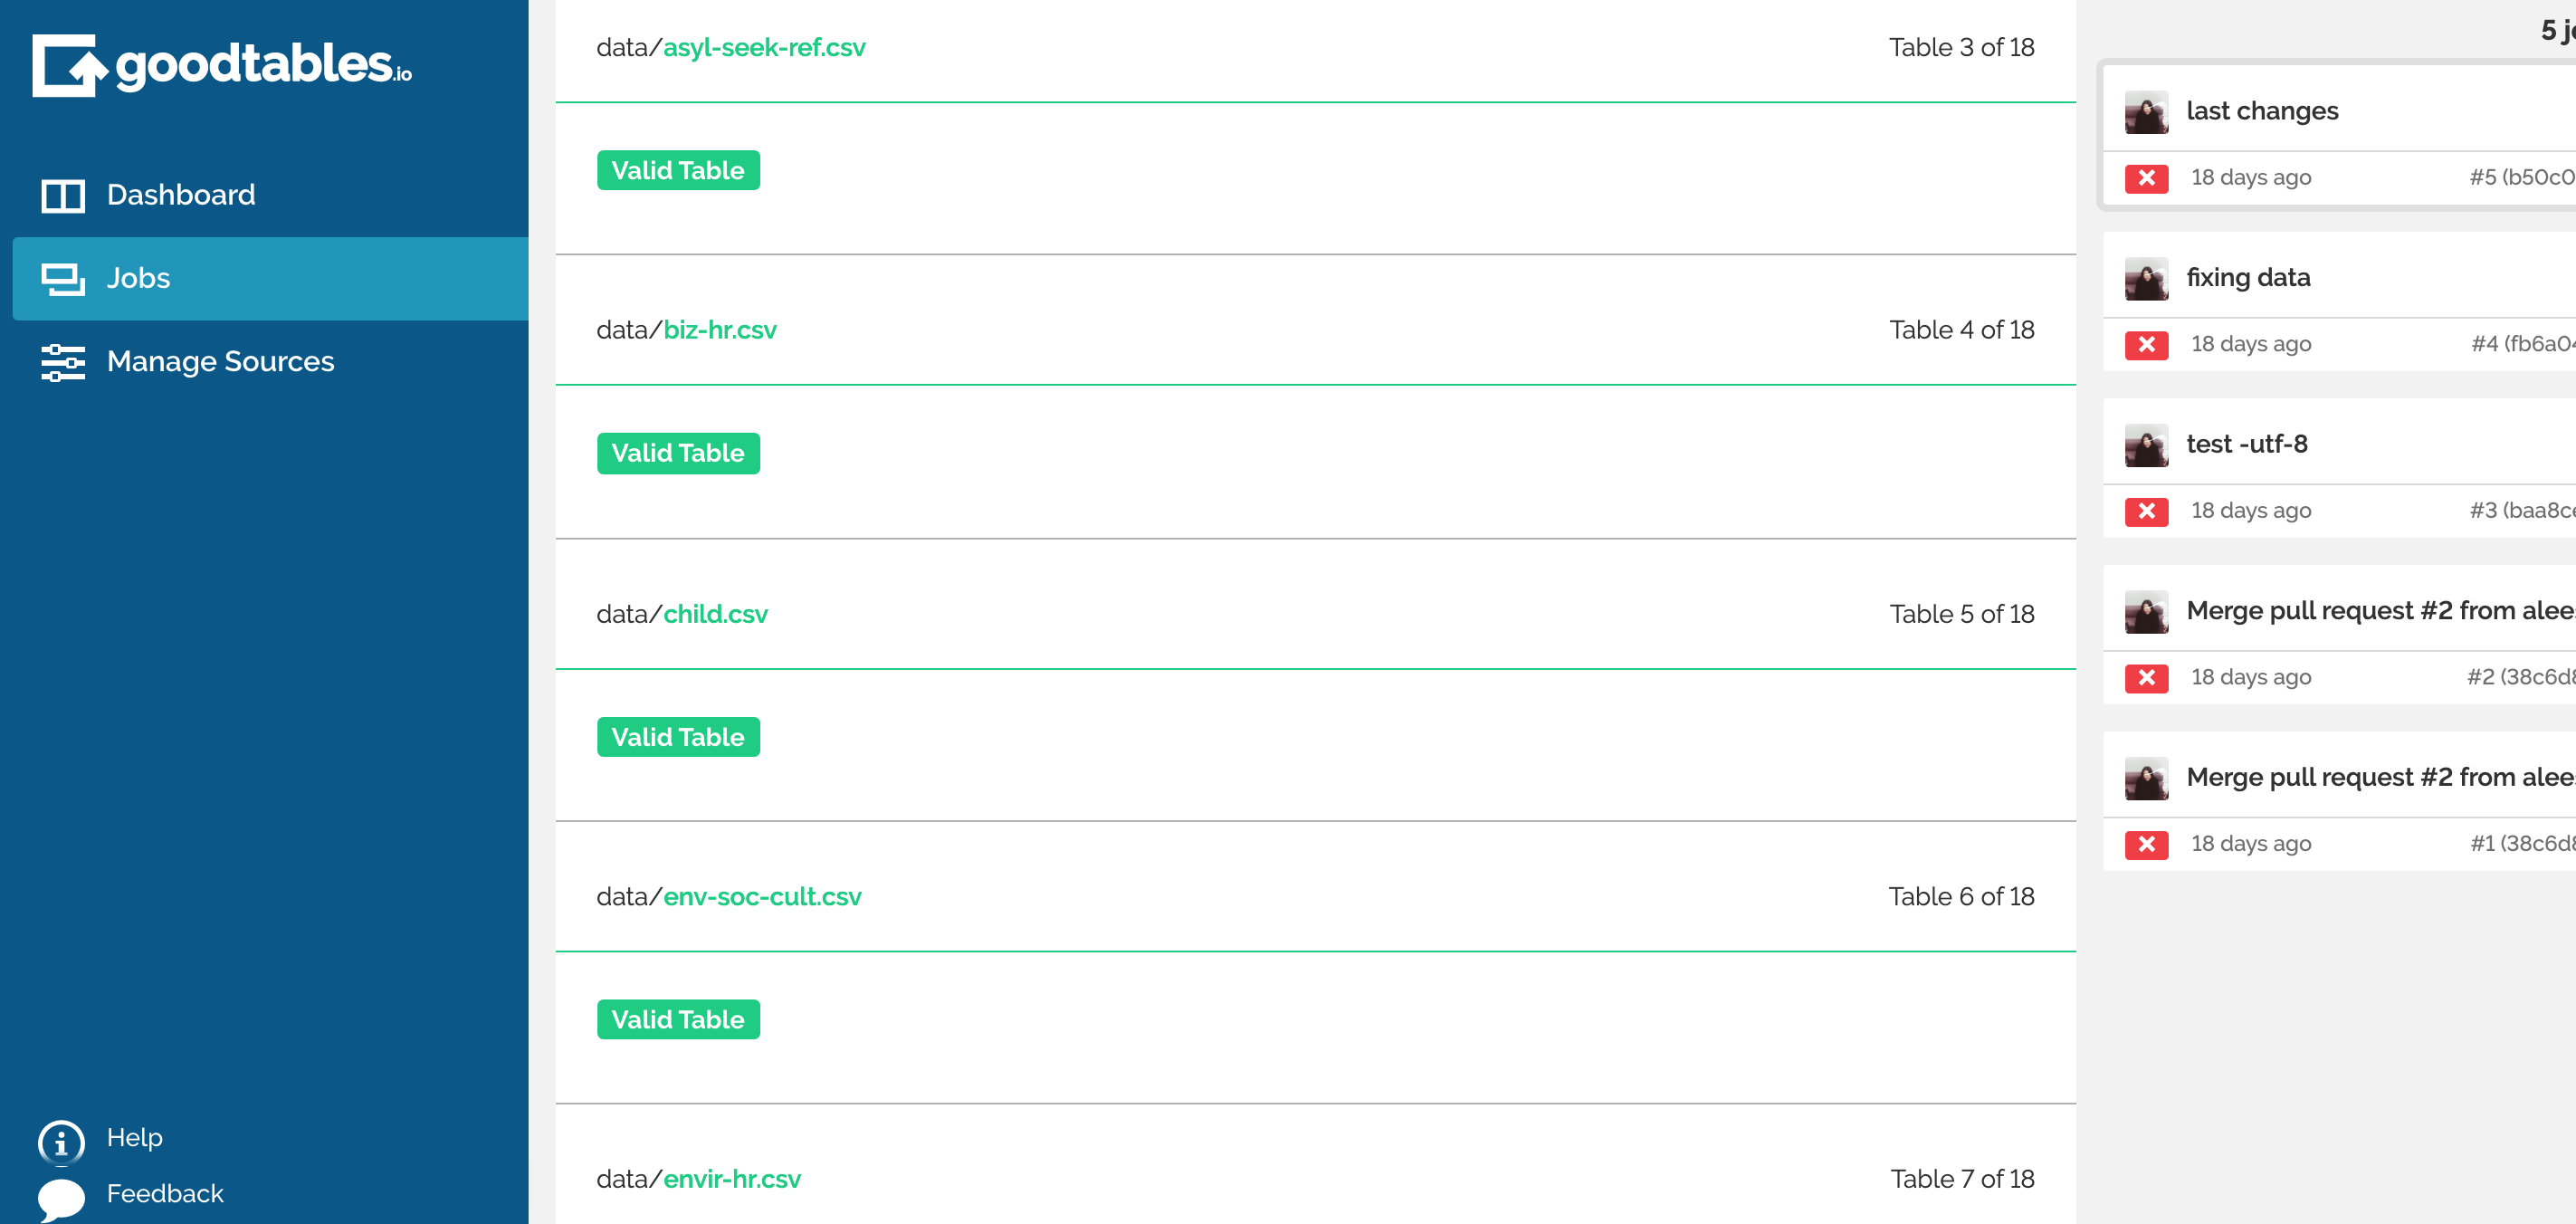
All solved!