Using Frictionless tools to help you understand open data
A few weeks ago, the fellows did an interesting exercise: We would try to replicate each others DataPackages in pairs. We had spent some time before creating and validating DataPacakges with our own data. Now it was the time to see how would it be to work with someone else's. This experience was intended to be a way for us to check how it was to be at the other side. That is, once we learnt to create a DataPackage, it was a good idea to receive a DataPackage created by another person to see whether it makes it easier for us to understand the details of the data.
Let's see how it went!
Validating the DataPackage
As a first step, we will take a peek at the DataPackage using the goodtables command-line tool. If you don't know what Goodtable is, I recommend you have a look at this blog post I wrote about it a few weeks ago and to the documention for further guidance.
goodtables Muranga_insects_dp.json
As we can see in the image below, directly calling goodtables on the DataPackage throws a bit of information, including a succinct description of the data (e.g. how many tables there are) and a general validation of it.
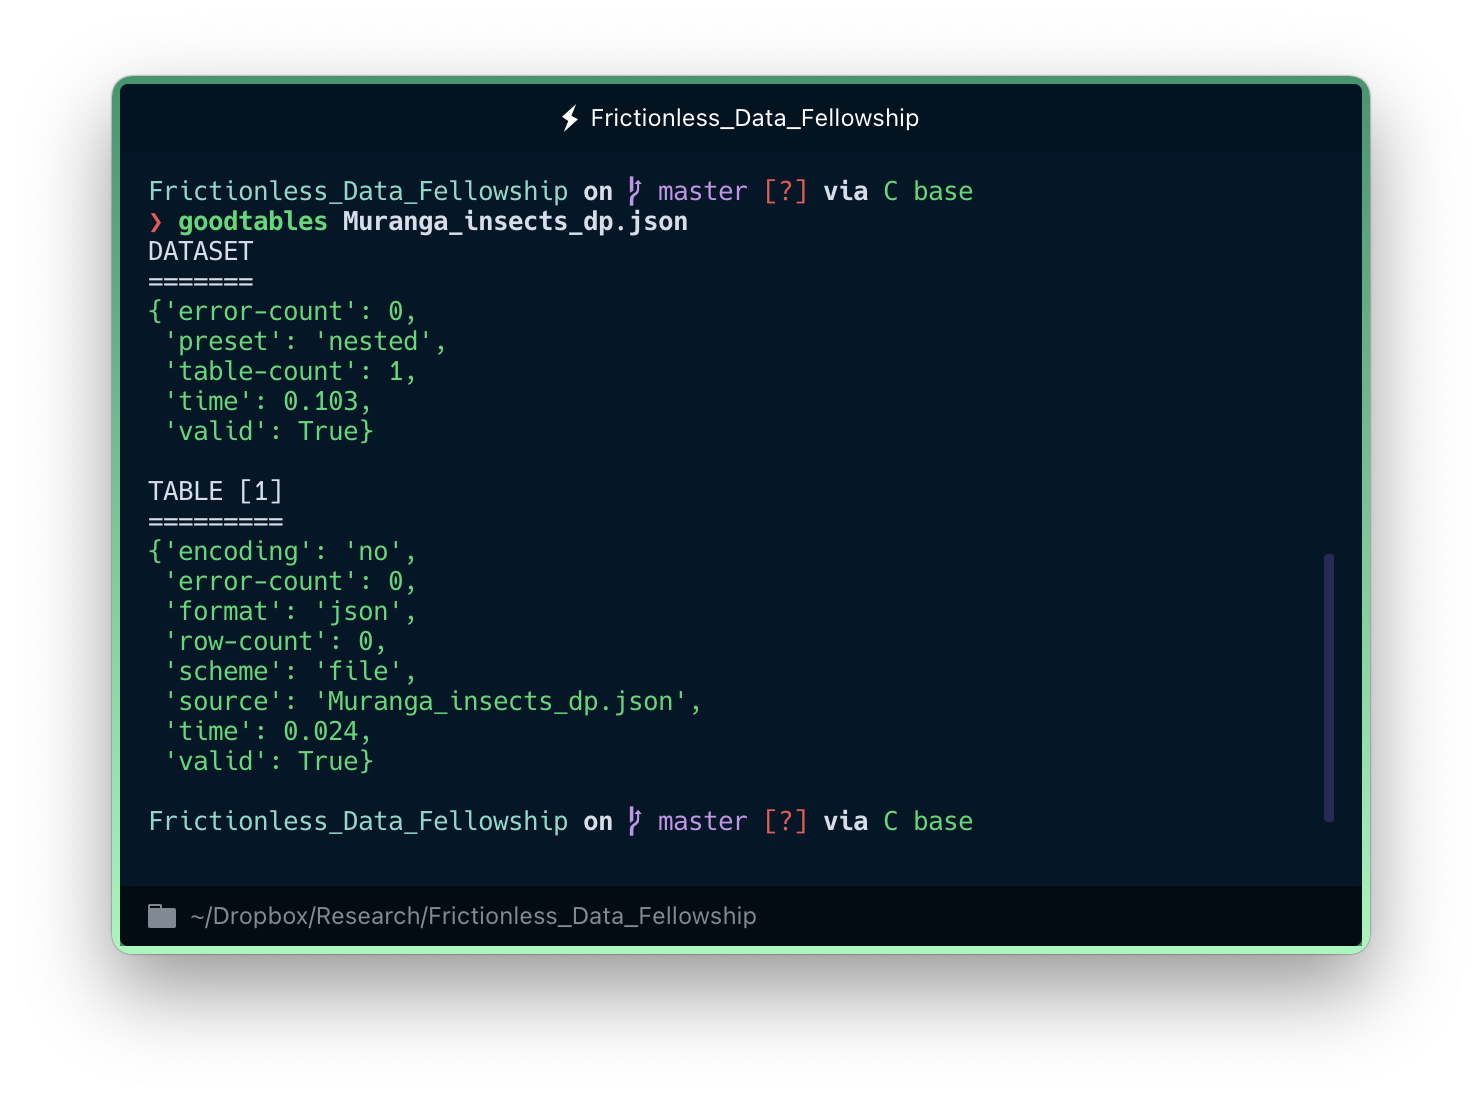
An overview of the DataPackage tells you whether the validation has been successful and the type of data structure inside. But we need to go deeper to better understand what we are dealing with.
Beyond the DataPackage: exploring the data files
Once we validated the DataPackage our colleague created, we have to consider the possibility that they –as any of us– might have made a msitake when creating it. It is therefore useful to explore the data files themselves, again using goodtables in the command line.
goodtables Muranga_insects.csv
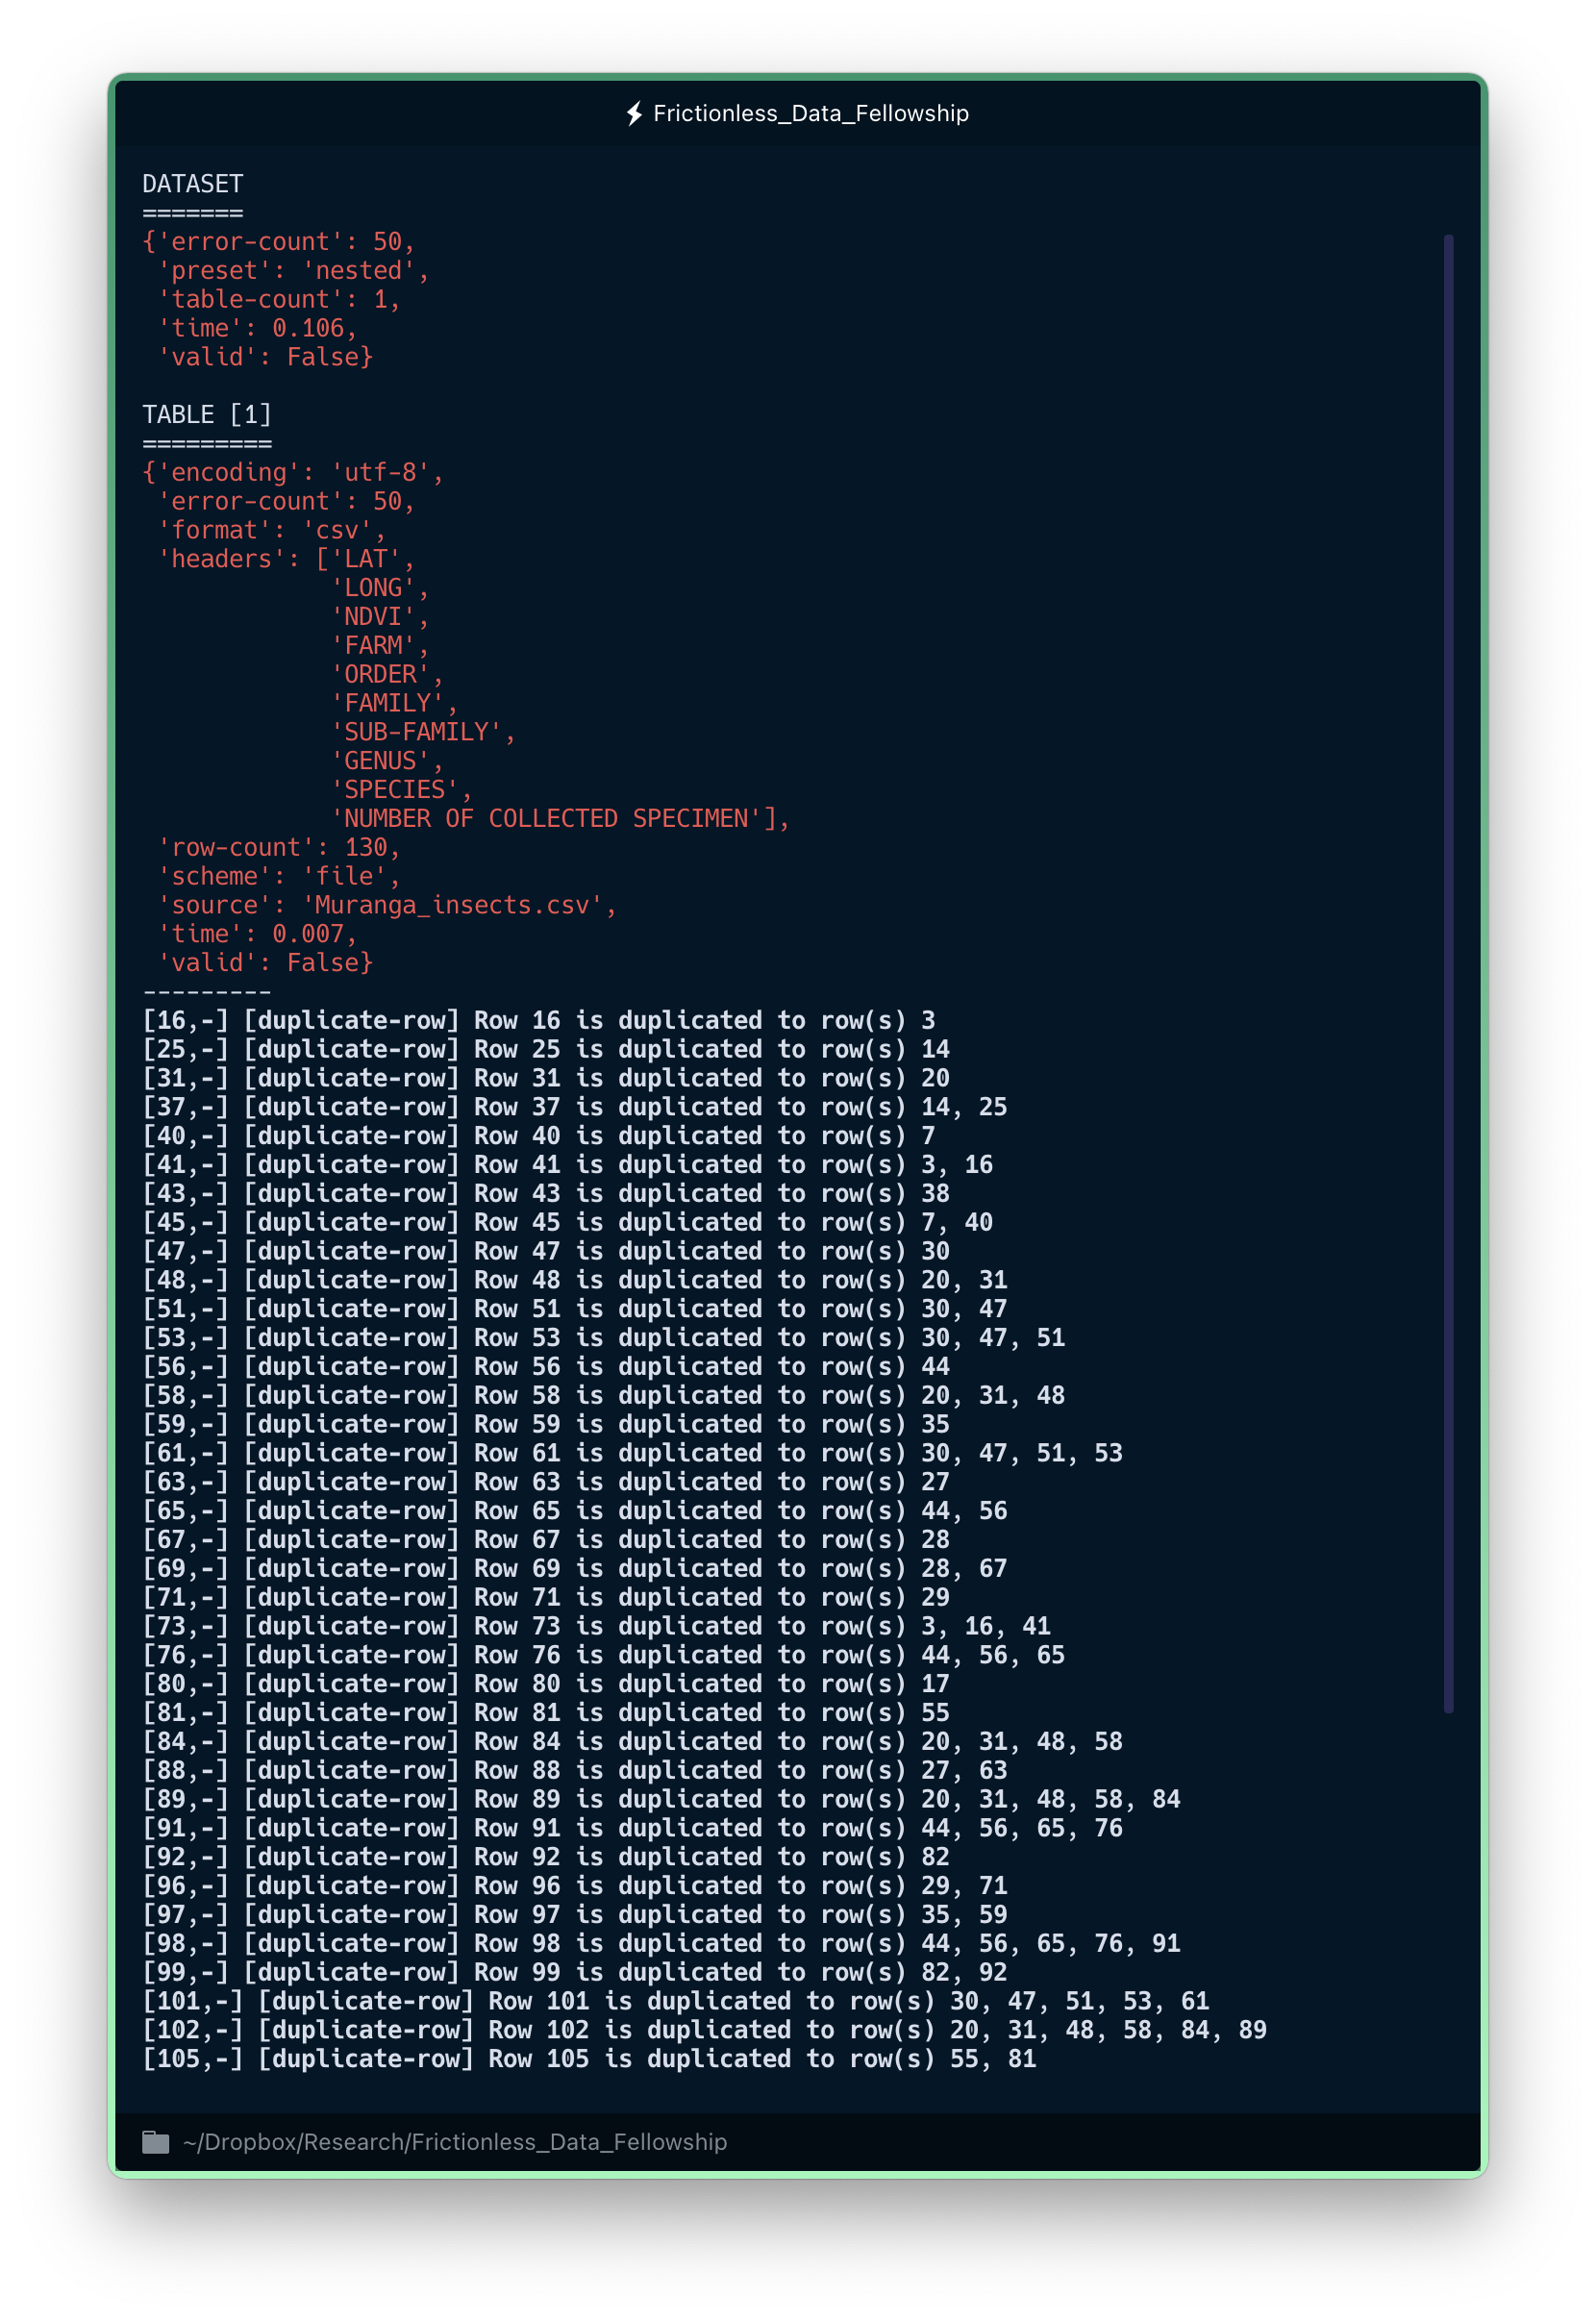
Goodtables is designed to pinpoint exactly where the errors are and what they mean, so you can fix them!
This time we got a lot more information... including some error messages. Let's see what they mean.
First of all, Goodtables tells us that it detected 50 errors in this data file - that's a lot! Maybe something else is going on. It also provides a list with the names of the columns in the dataset, as well as the number of observations (i.e. rows) we have.
Now, if we look at the bottom of the error message, we find a bunch of duplicate row messages. That's very odd! It could happen, of course. But it's strange that a file with 130 rows would have 20 duplicates (that's about 15%), don't you think?
In this case, we can use another Frictionless Tool to take a look at the dataset and see what is really going on with the data. We will use frictionless extract to visualise the data in a structured tabular format to help us inspect the information visually. This tool is part of the Frictionless framework, a new way of working with Frictionless Tools to describe, extract, validate, and transform tabular data. I encourage you to read through the documentation here to learn more. It's full of examples and tutorials!
frictionless extract Muranga_insects.csv
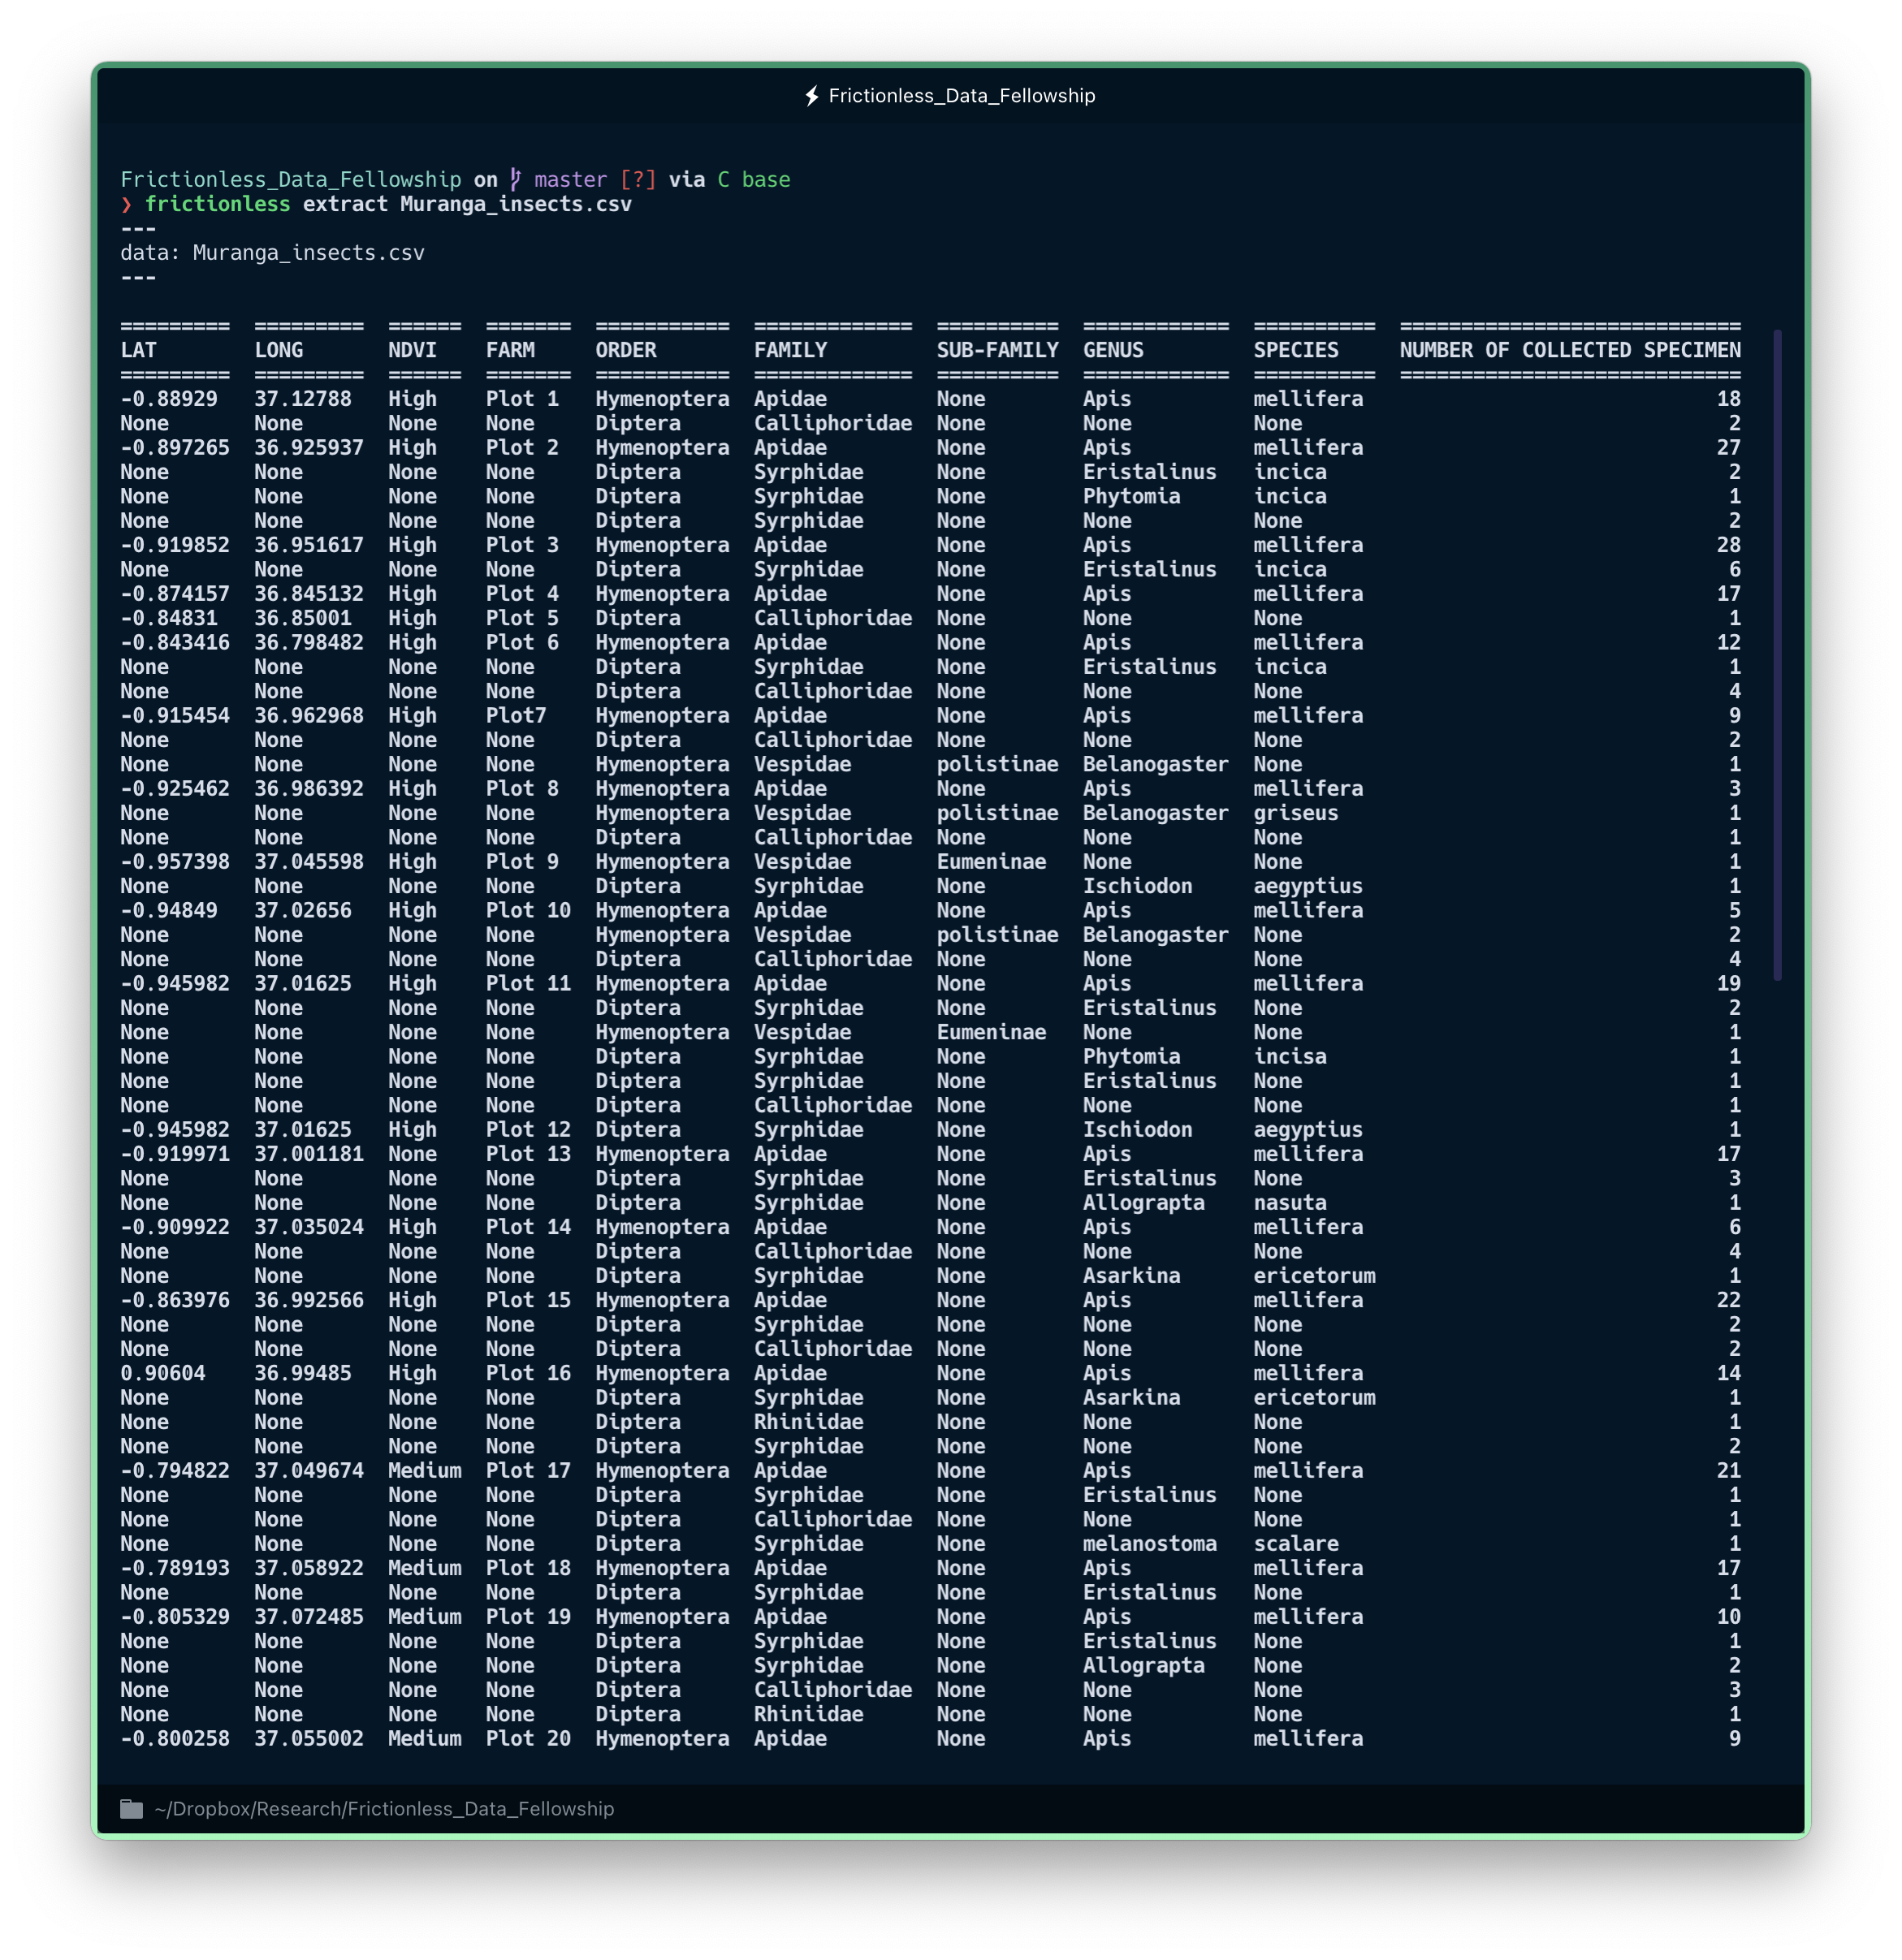
Visualising tabular data structures can be a bit of a nightmare in Python. Fortunately, `frictionless extract` was conceived to make life easier for us humans!
Now we can see what was going on with the data. There are a lot of missing values!
There is probably a logical explanation for this, though. The first two columns (LAT and LONG) act as site identifiers for each observation. However, it appears that our colleague organised her data in such a way that these identifiers appear only once and all observations from each site are grouped together. This way of organising the data is very convenient visually when you are used to spreadsheet software such as Excel, but it can mess things up a bit if you try to automate some analyses or tasks with a programming language.
Mystery solved! Although Goodtables told us that the DataPackage JSON file was valid, it found a number of issues in the CSV data file.
Room for improvement
When working with tabular data, we can adopt a number of good practices to make it easier for others to reuse our data. For this dataset, we could suggest the following modifications:
- Adding text descriptions to variable names. It is incredibly common that, when creating a dataset, we take for granted our naming conventions and preferences, so we all tend to assume anyone will be able to understand what the name of each variable means. However, I dare saying that in most cases (and especially when using abbreviations) this is not going to be the case.
- Specifying data type for each variable. By default, the online DataPackage creator sometimes can't guess the correct data type, so will add the label any to this field. Although this is not necessarily problematic on itself, it doesn't provide any (pun intended) extra information for future users.
- Providing a permanent link to the source data, instead of creating the DataPackage using local data. A permanent link will ensure that everyone will be able to access the data in the future, even if you loose your own data. You can also think about this as a backup of your data. Besides, this helps us avoid some inconviniences such as dealing with weird paths, which can be an (unnecesary) extra blockage for those users less experienced with programming languages and the command line.
- Adding a license to the DataPackage. Even if you take all the time and effort to go through the process of packaging your data, other people cannot know whether they can use your data unless you specify a license. Fortunately, the DataPackage Creator has you covered! You will find in the left-hand menu a field to specify a license for your data, with a drop-down menu to select from a pre-specified list of possible licenses –you can write down any other license you prefer, though.